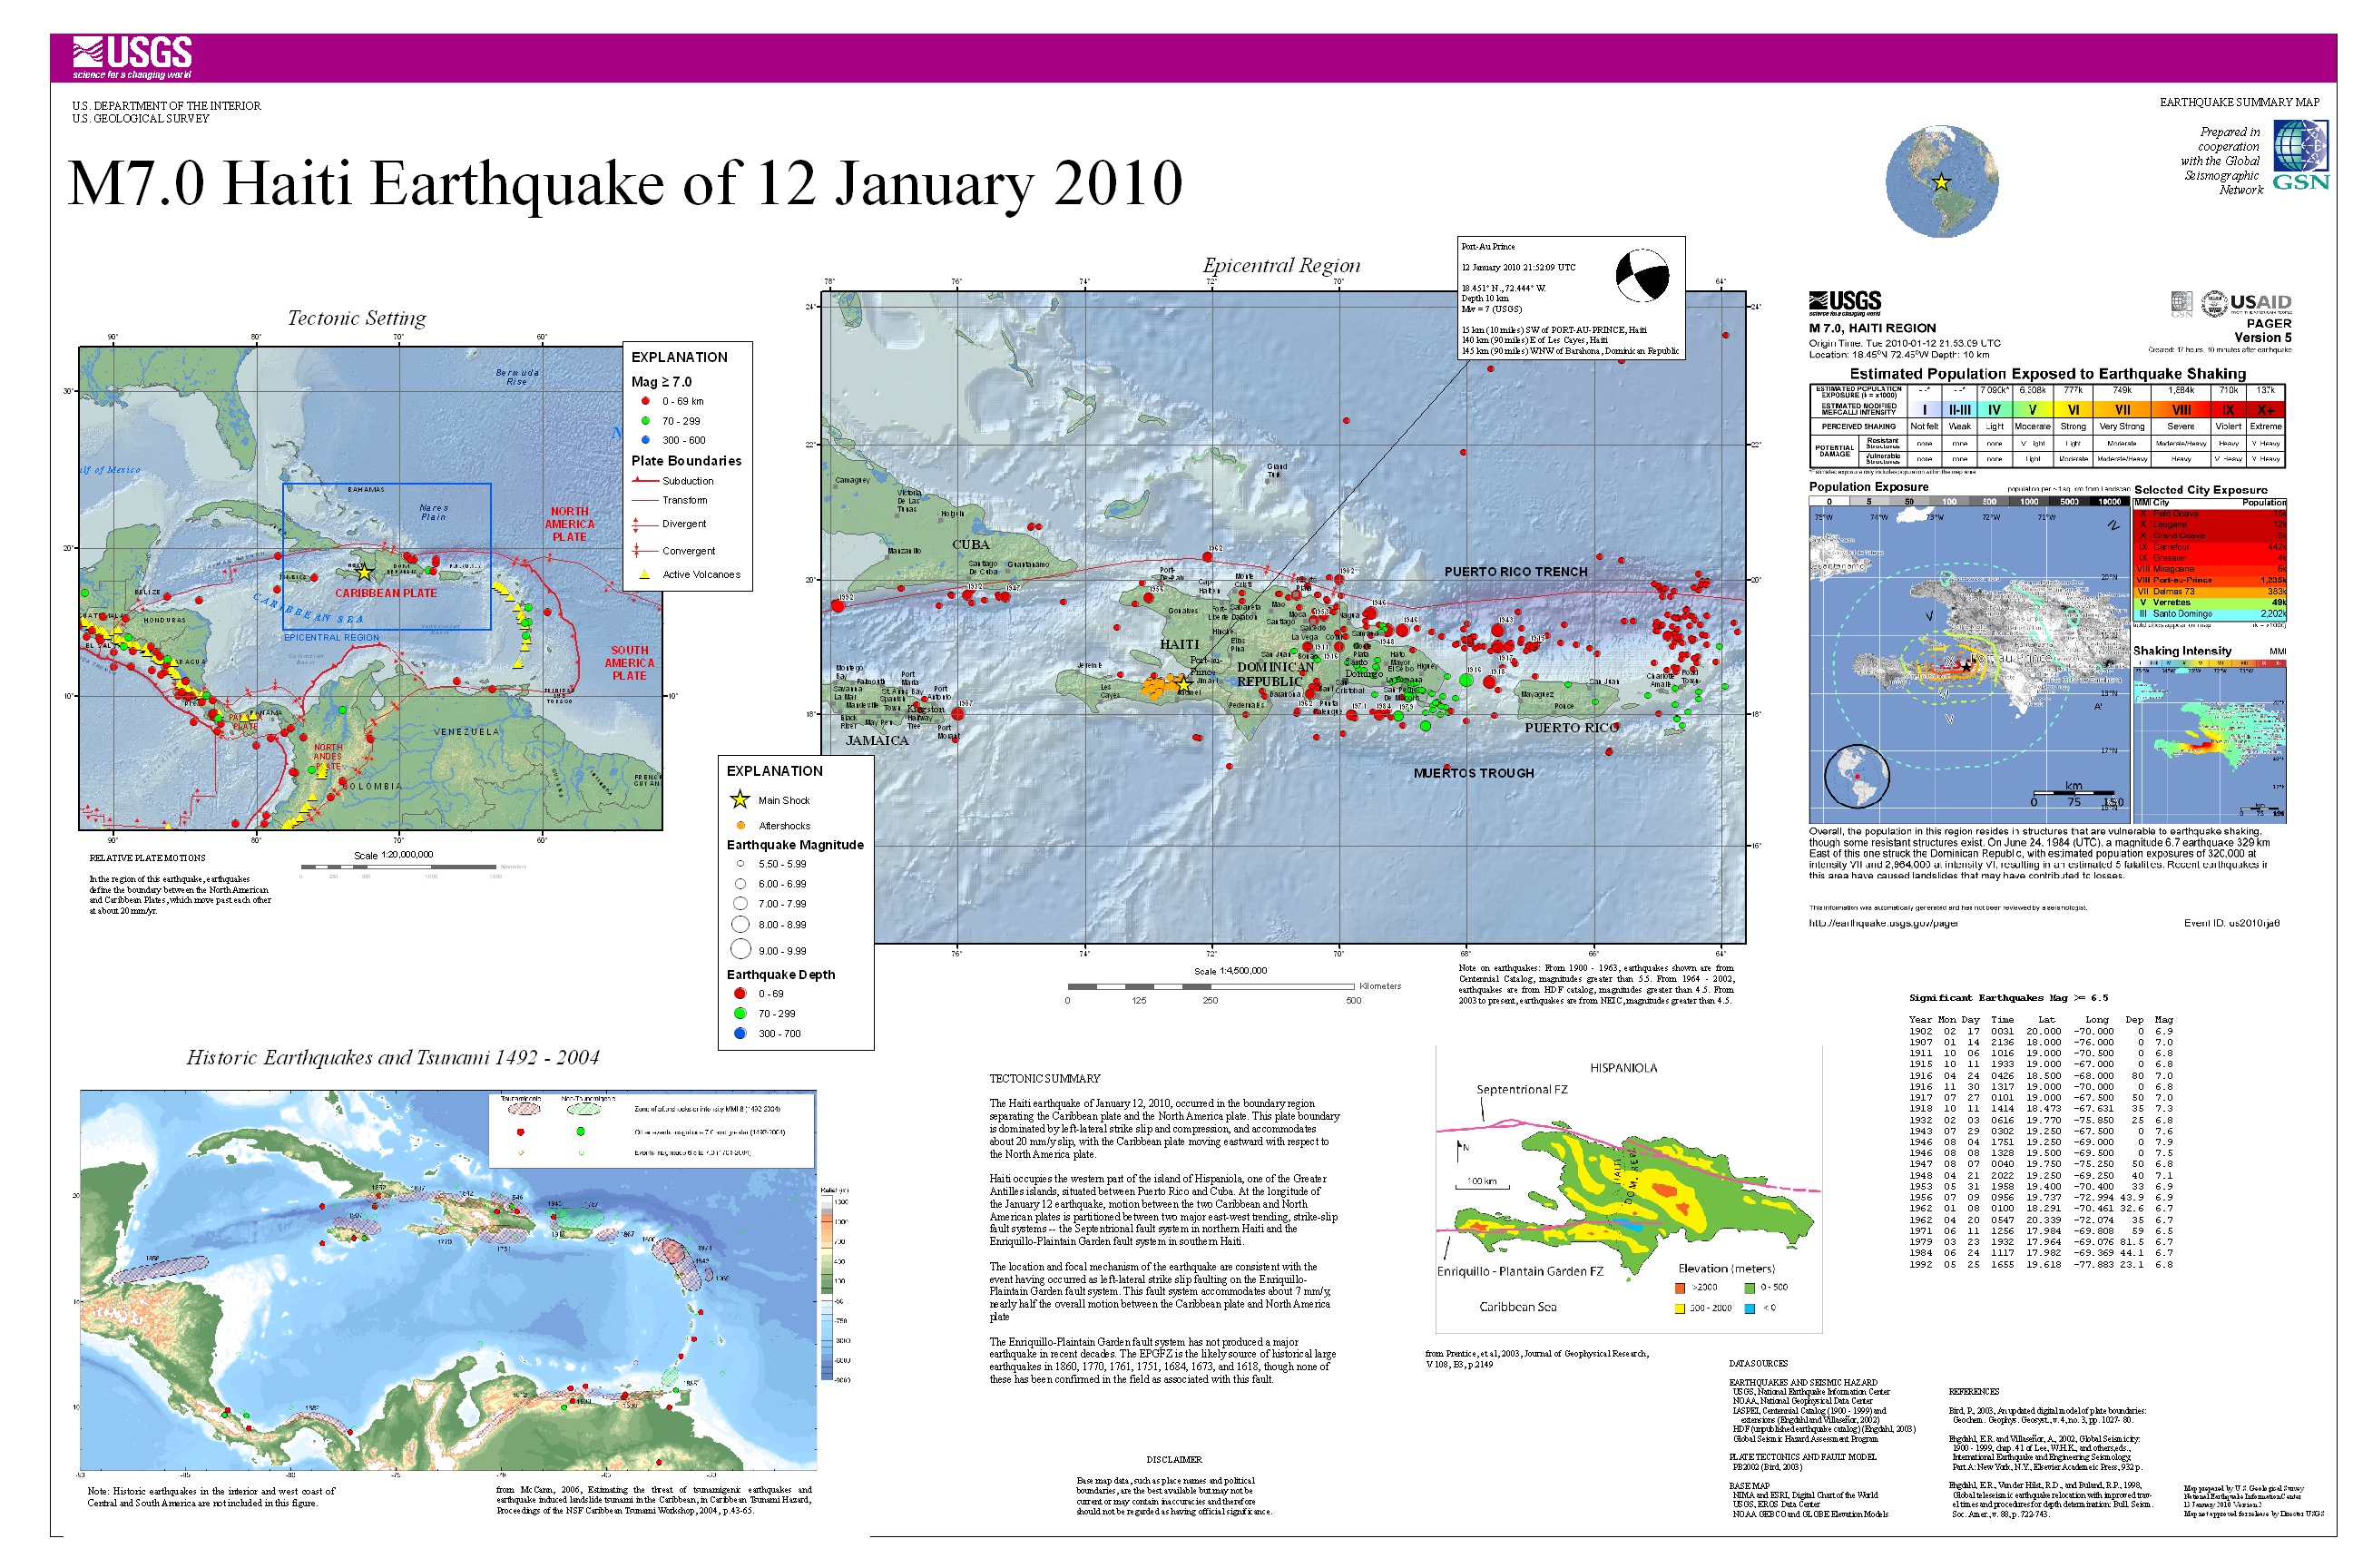
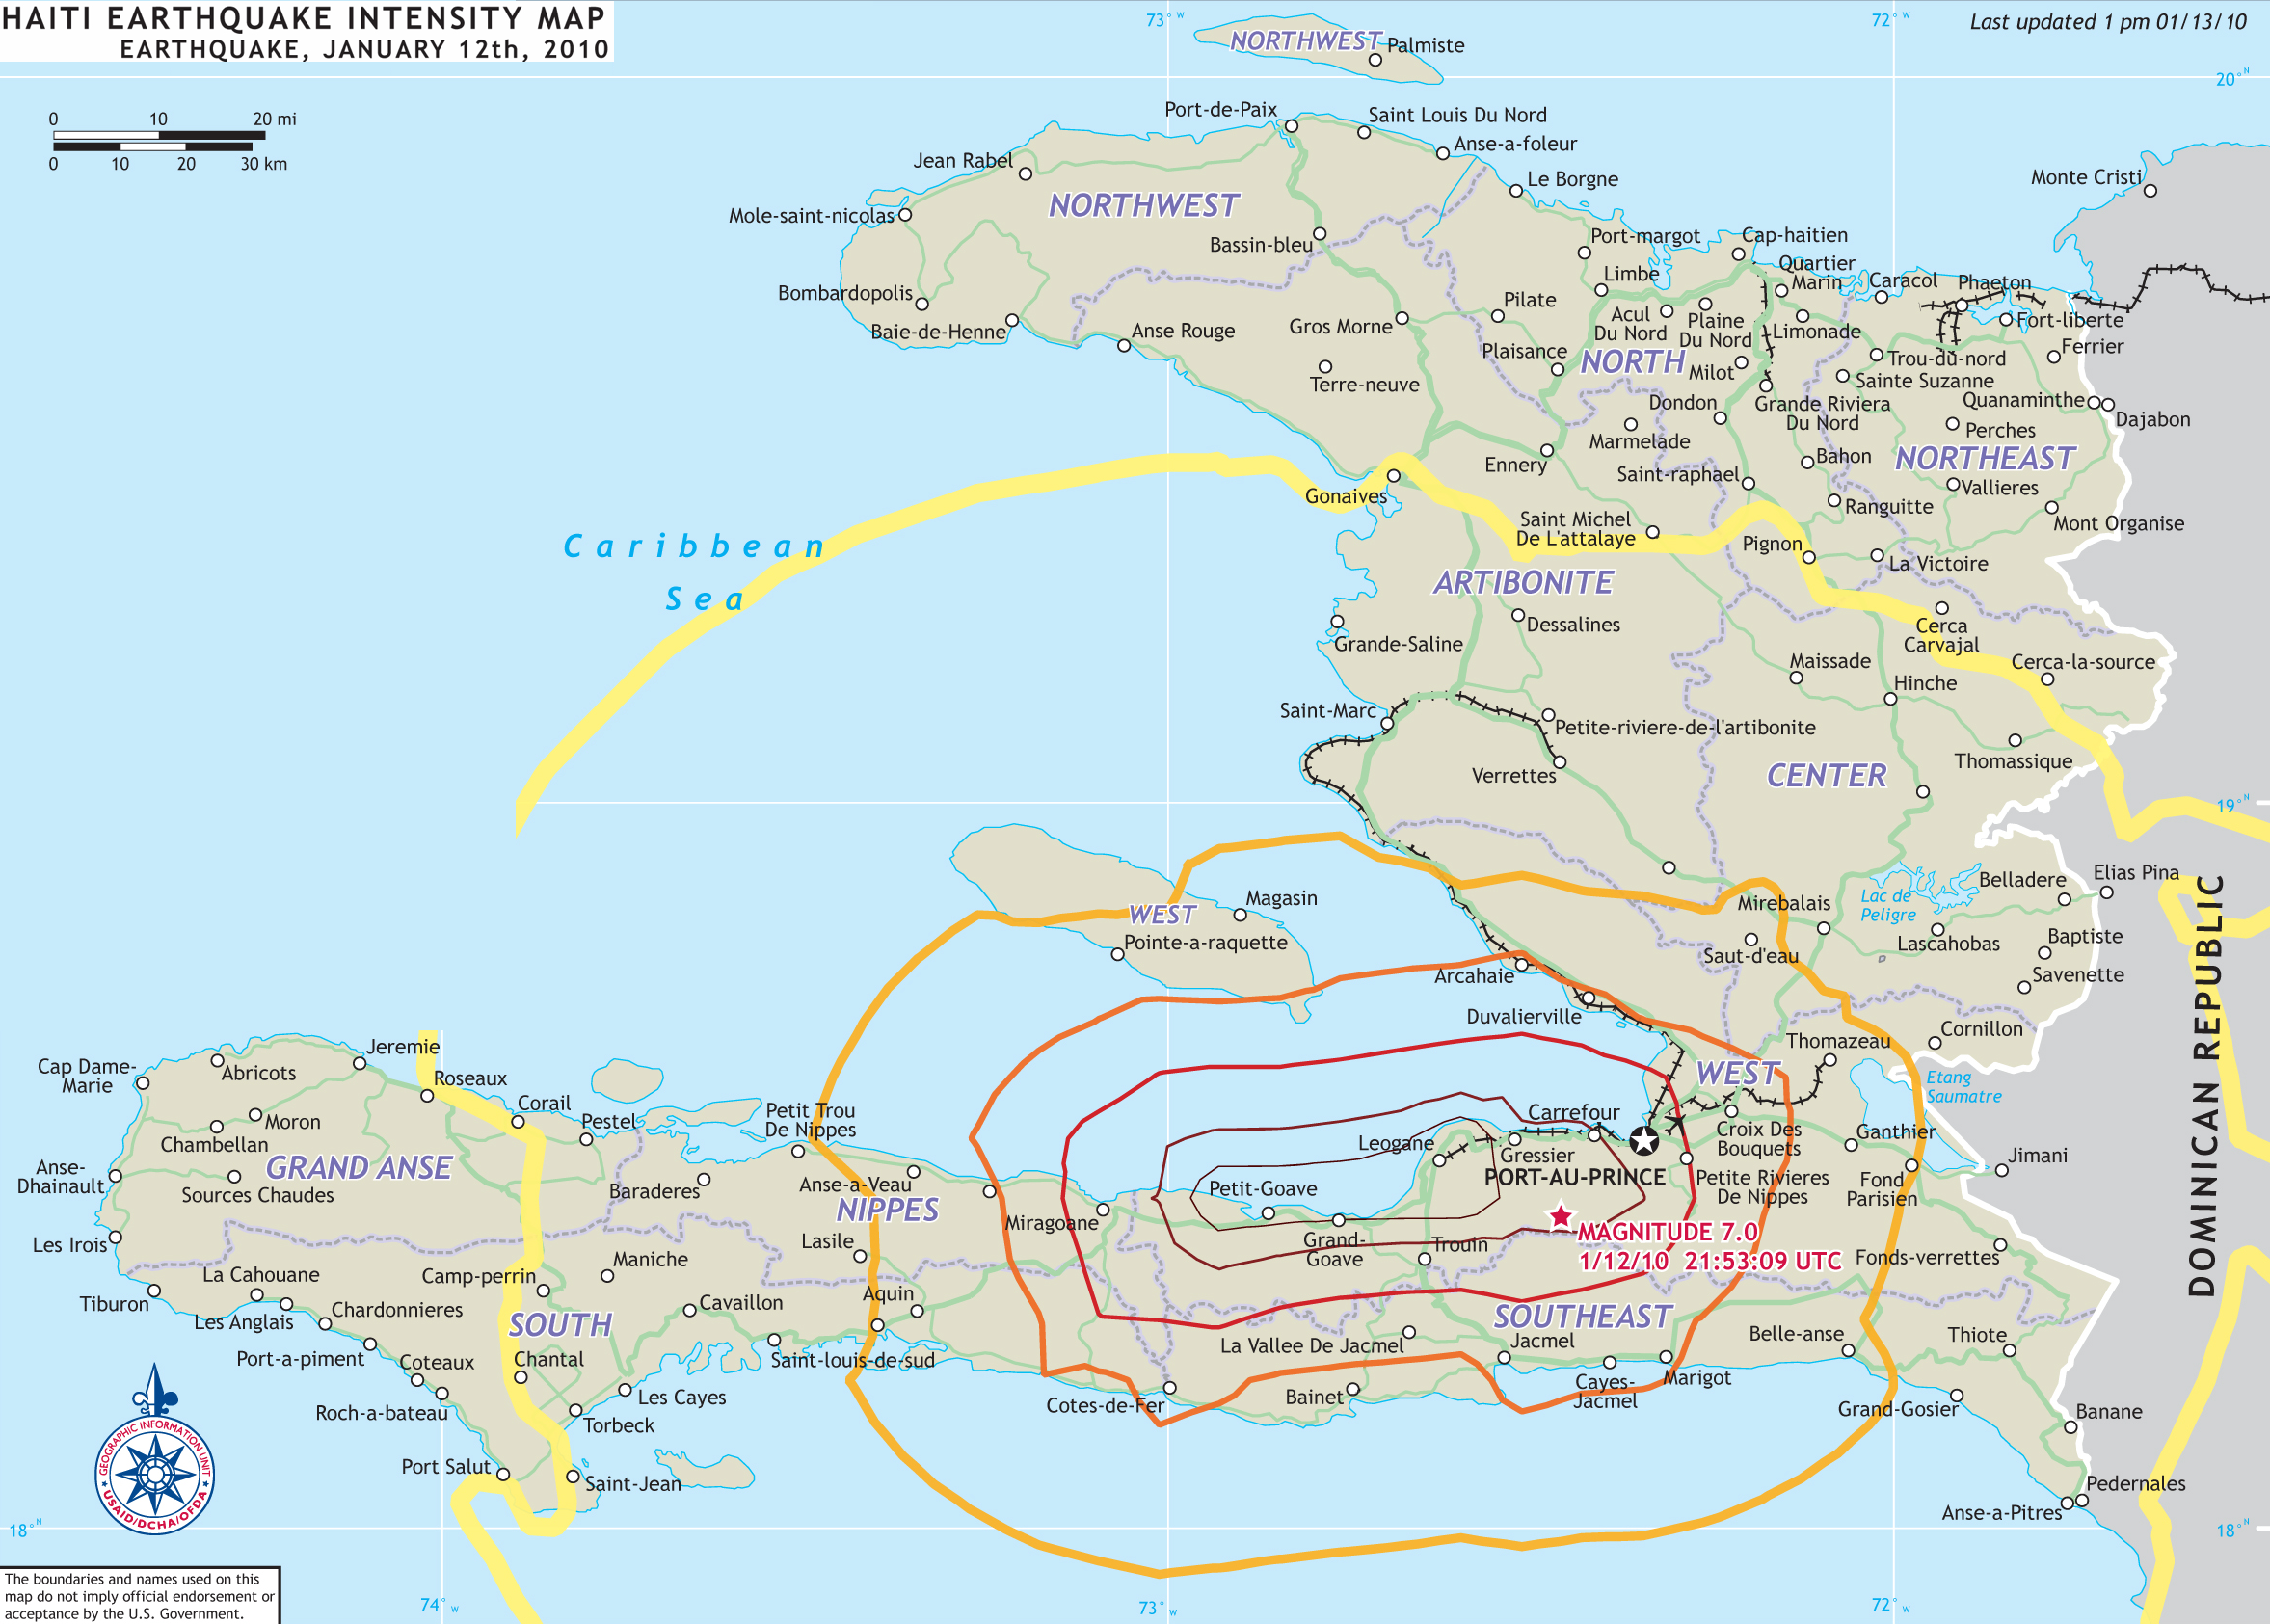
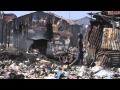
Country: Haiti
[ Hazard ]
Event Date
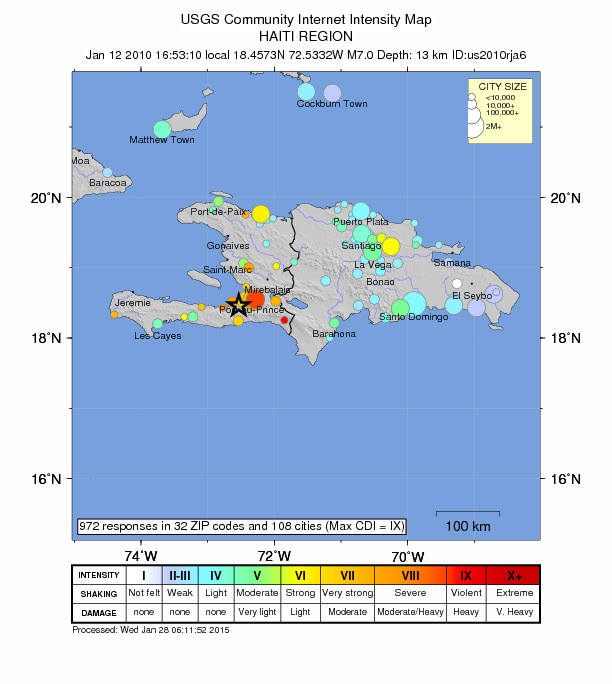
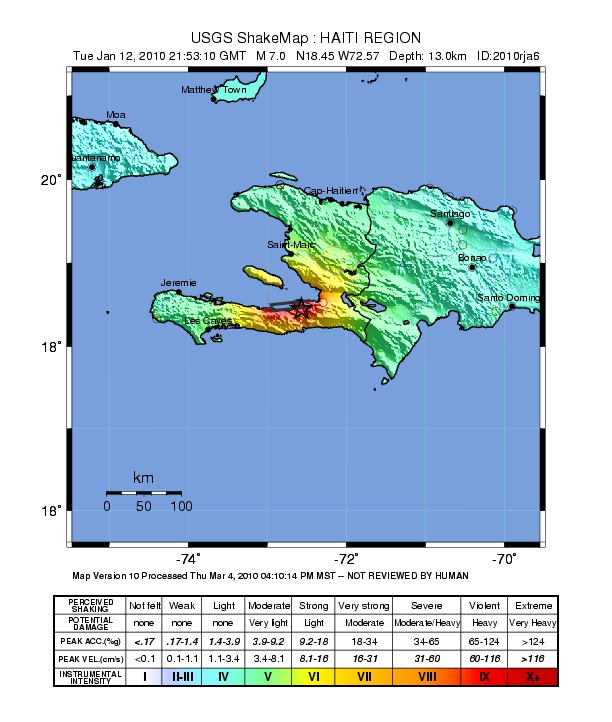
January 12, 2010
Moment Magnitude Scale (Mw)
7.0
Modified Mercalli Intensity Scale (MMI)
X (Extreme) at Petit Goave
X (Extreme) at Grand Goave
X (Extreme) at Gressier
IX (Violent) at Leogane
IX (Violent) at Carrefour
VIII (Severe) at Miragoane
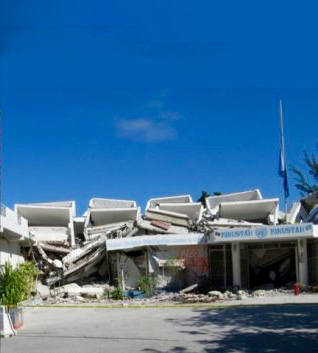
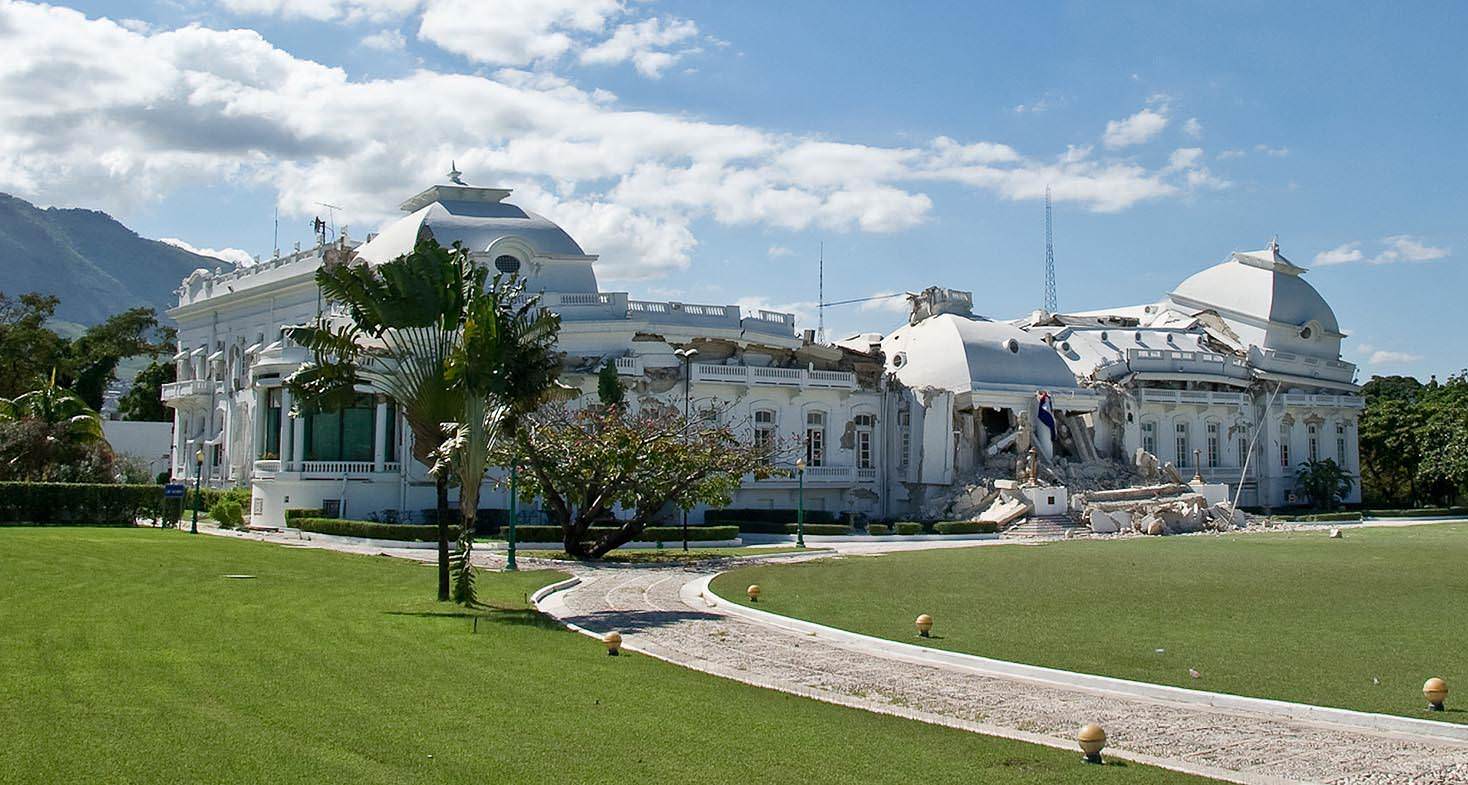
VIII (Severe) at Port-au-Prince
VIII (Severe) at Delmas
Notable Features
• Depth: 8.1 miles (13 km)
• Time: 21:53:10 UTC
• Epicenter: 18.443°N, 72.571°W, 15 miles (25 km) SW of Port-Au-Prince, Haiti
• Tectonic Feature: Enriquillo–Plantain Garden Fault Zone
Source(s)
US Geological Survey
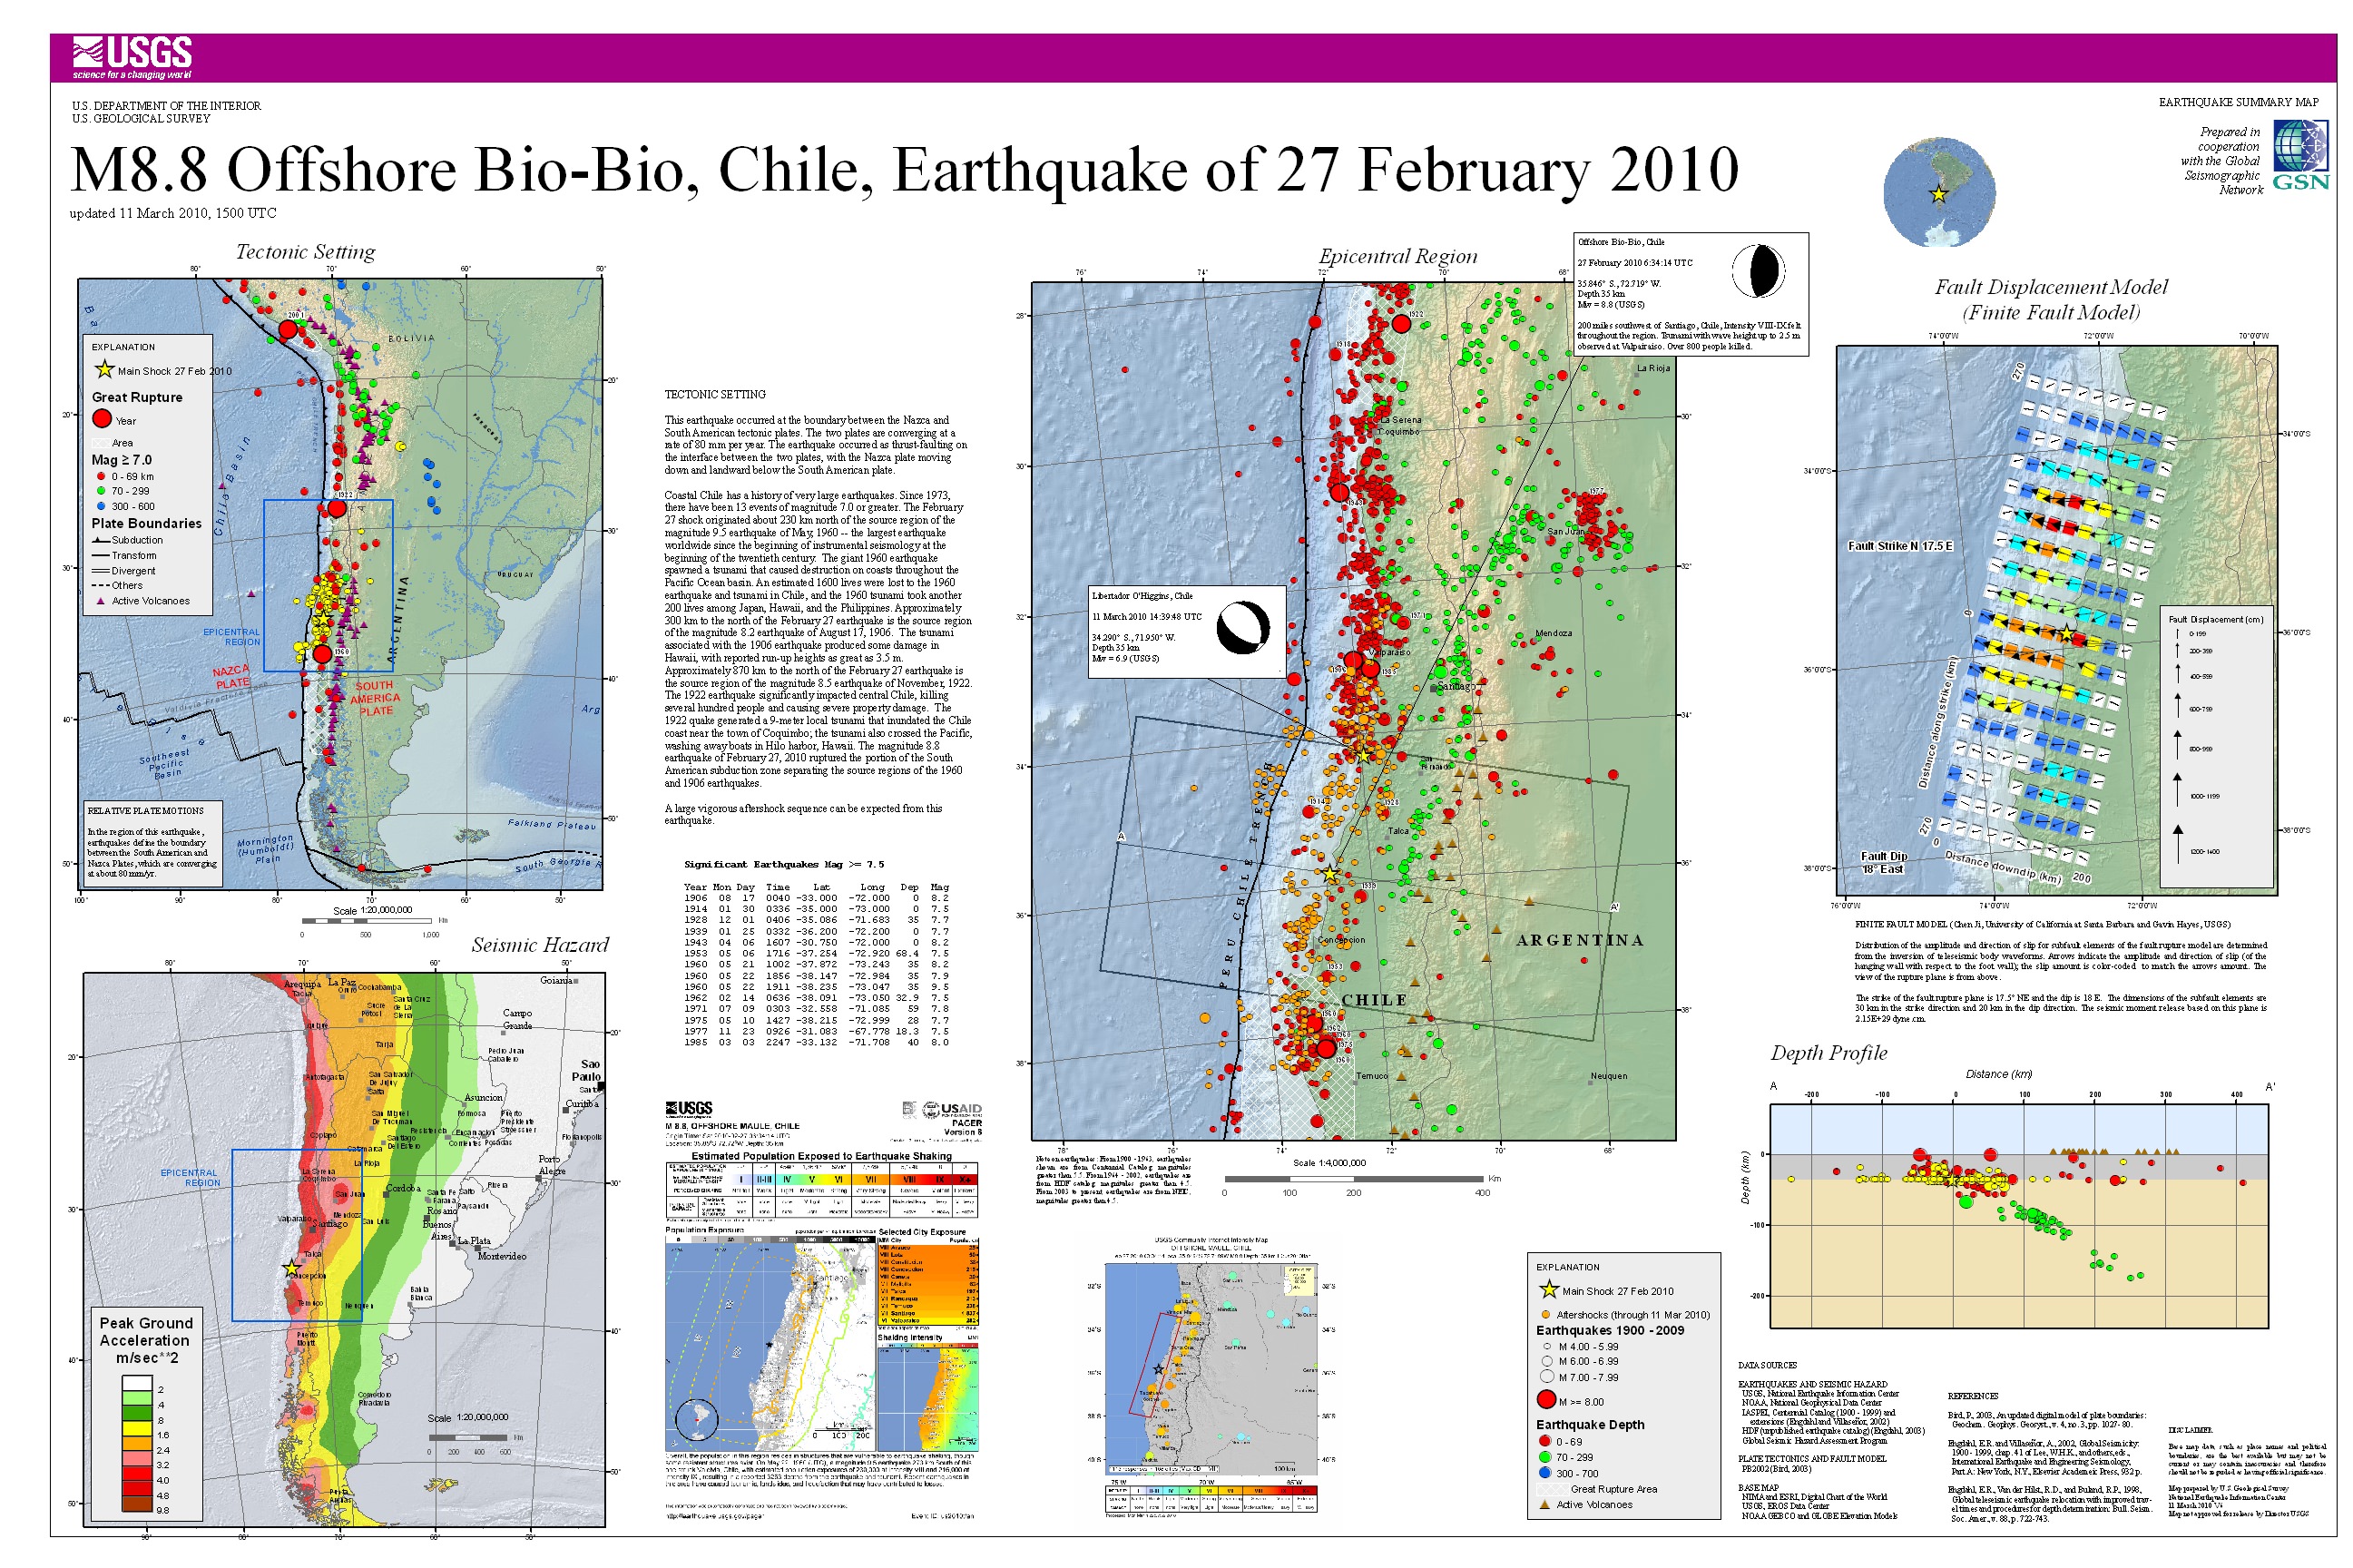
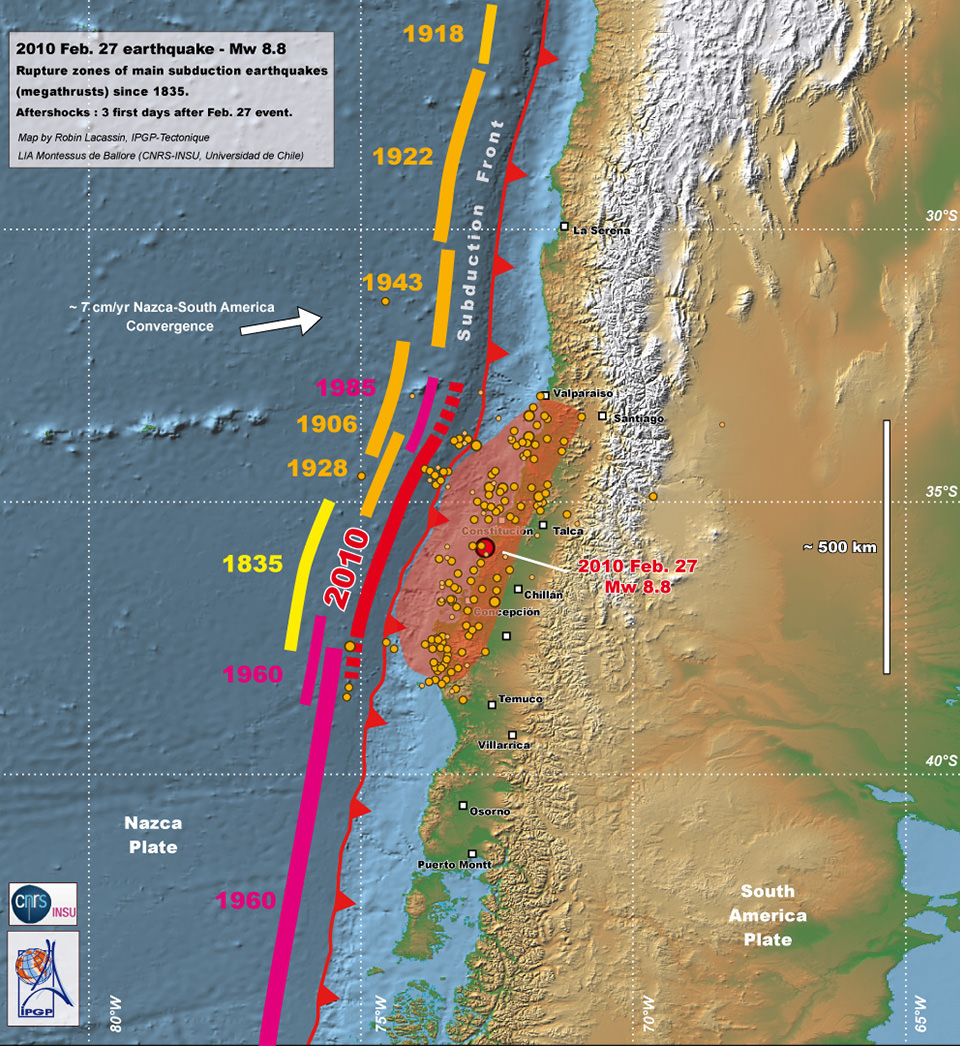
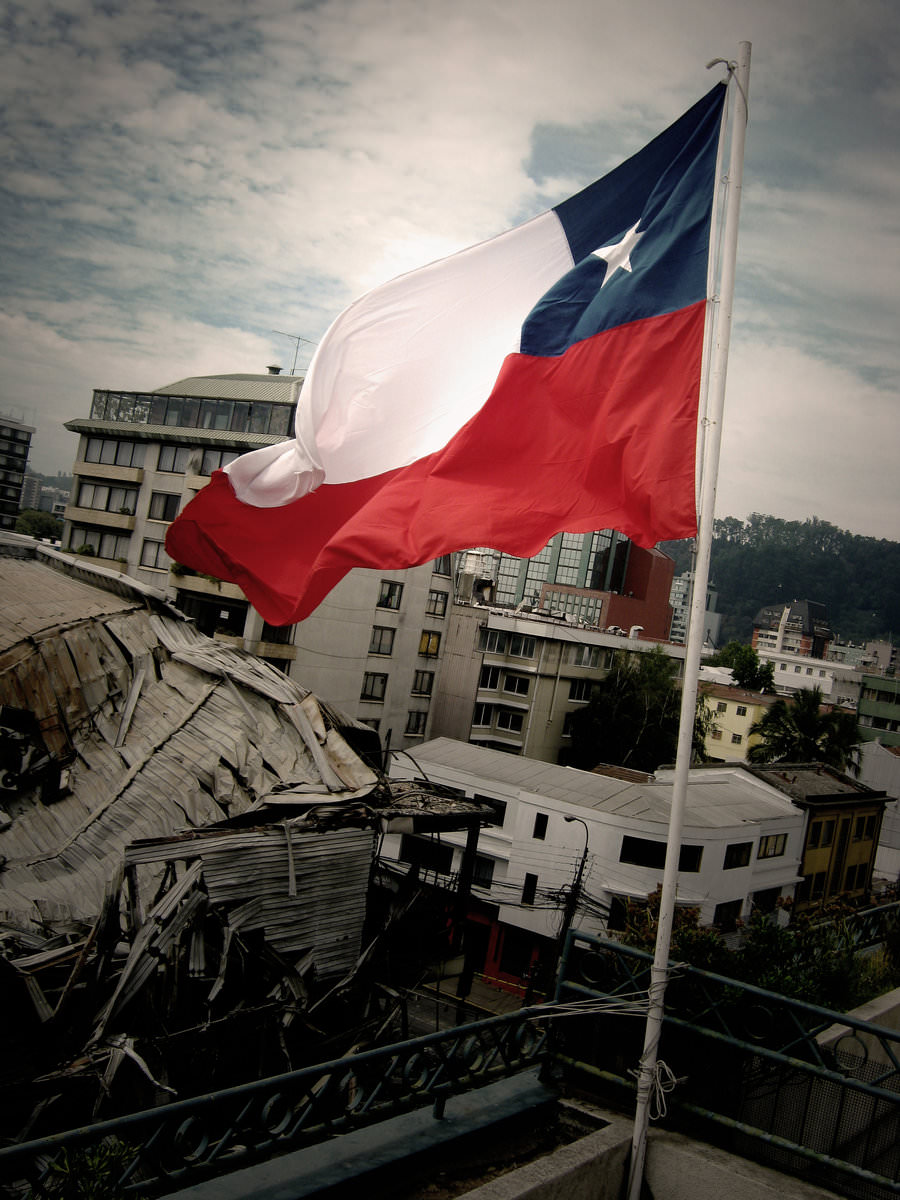
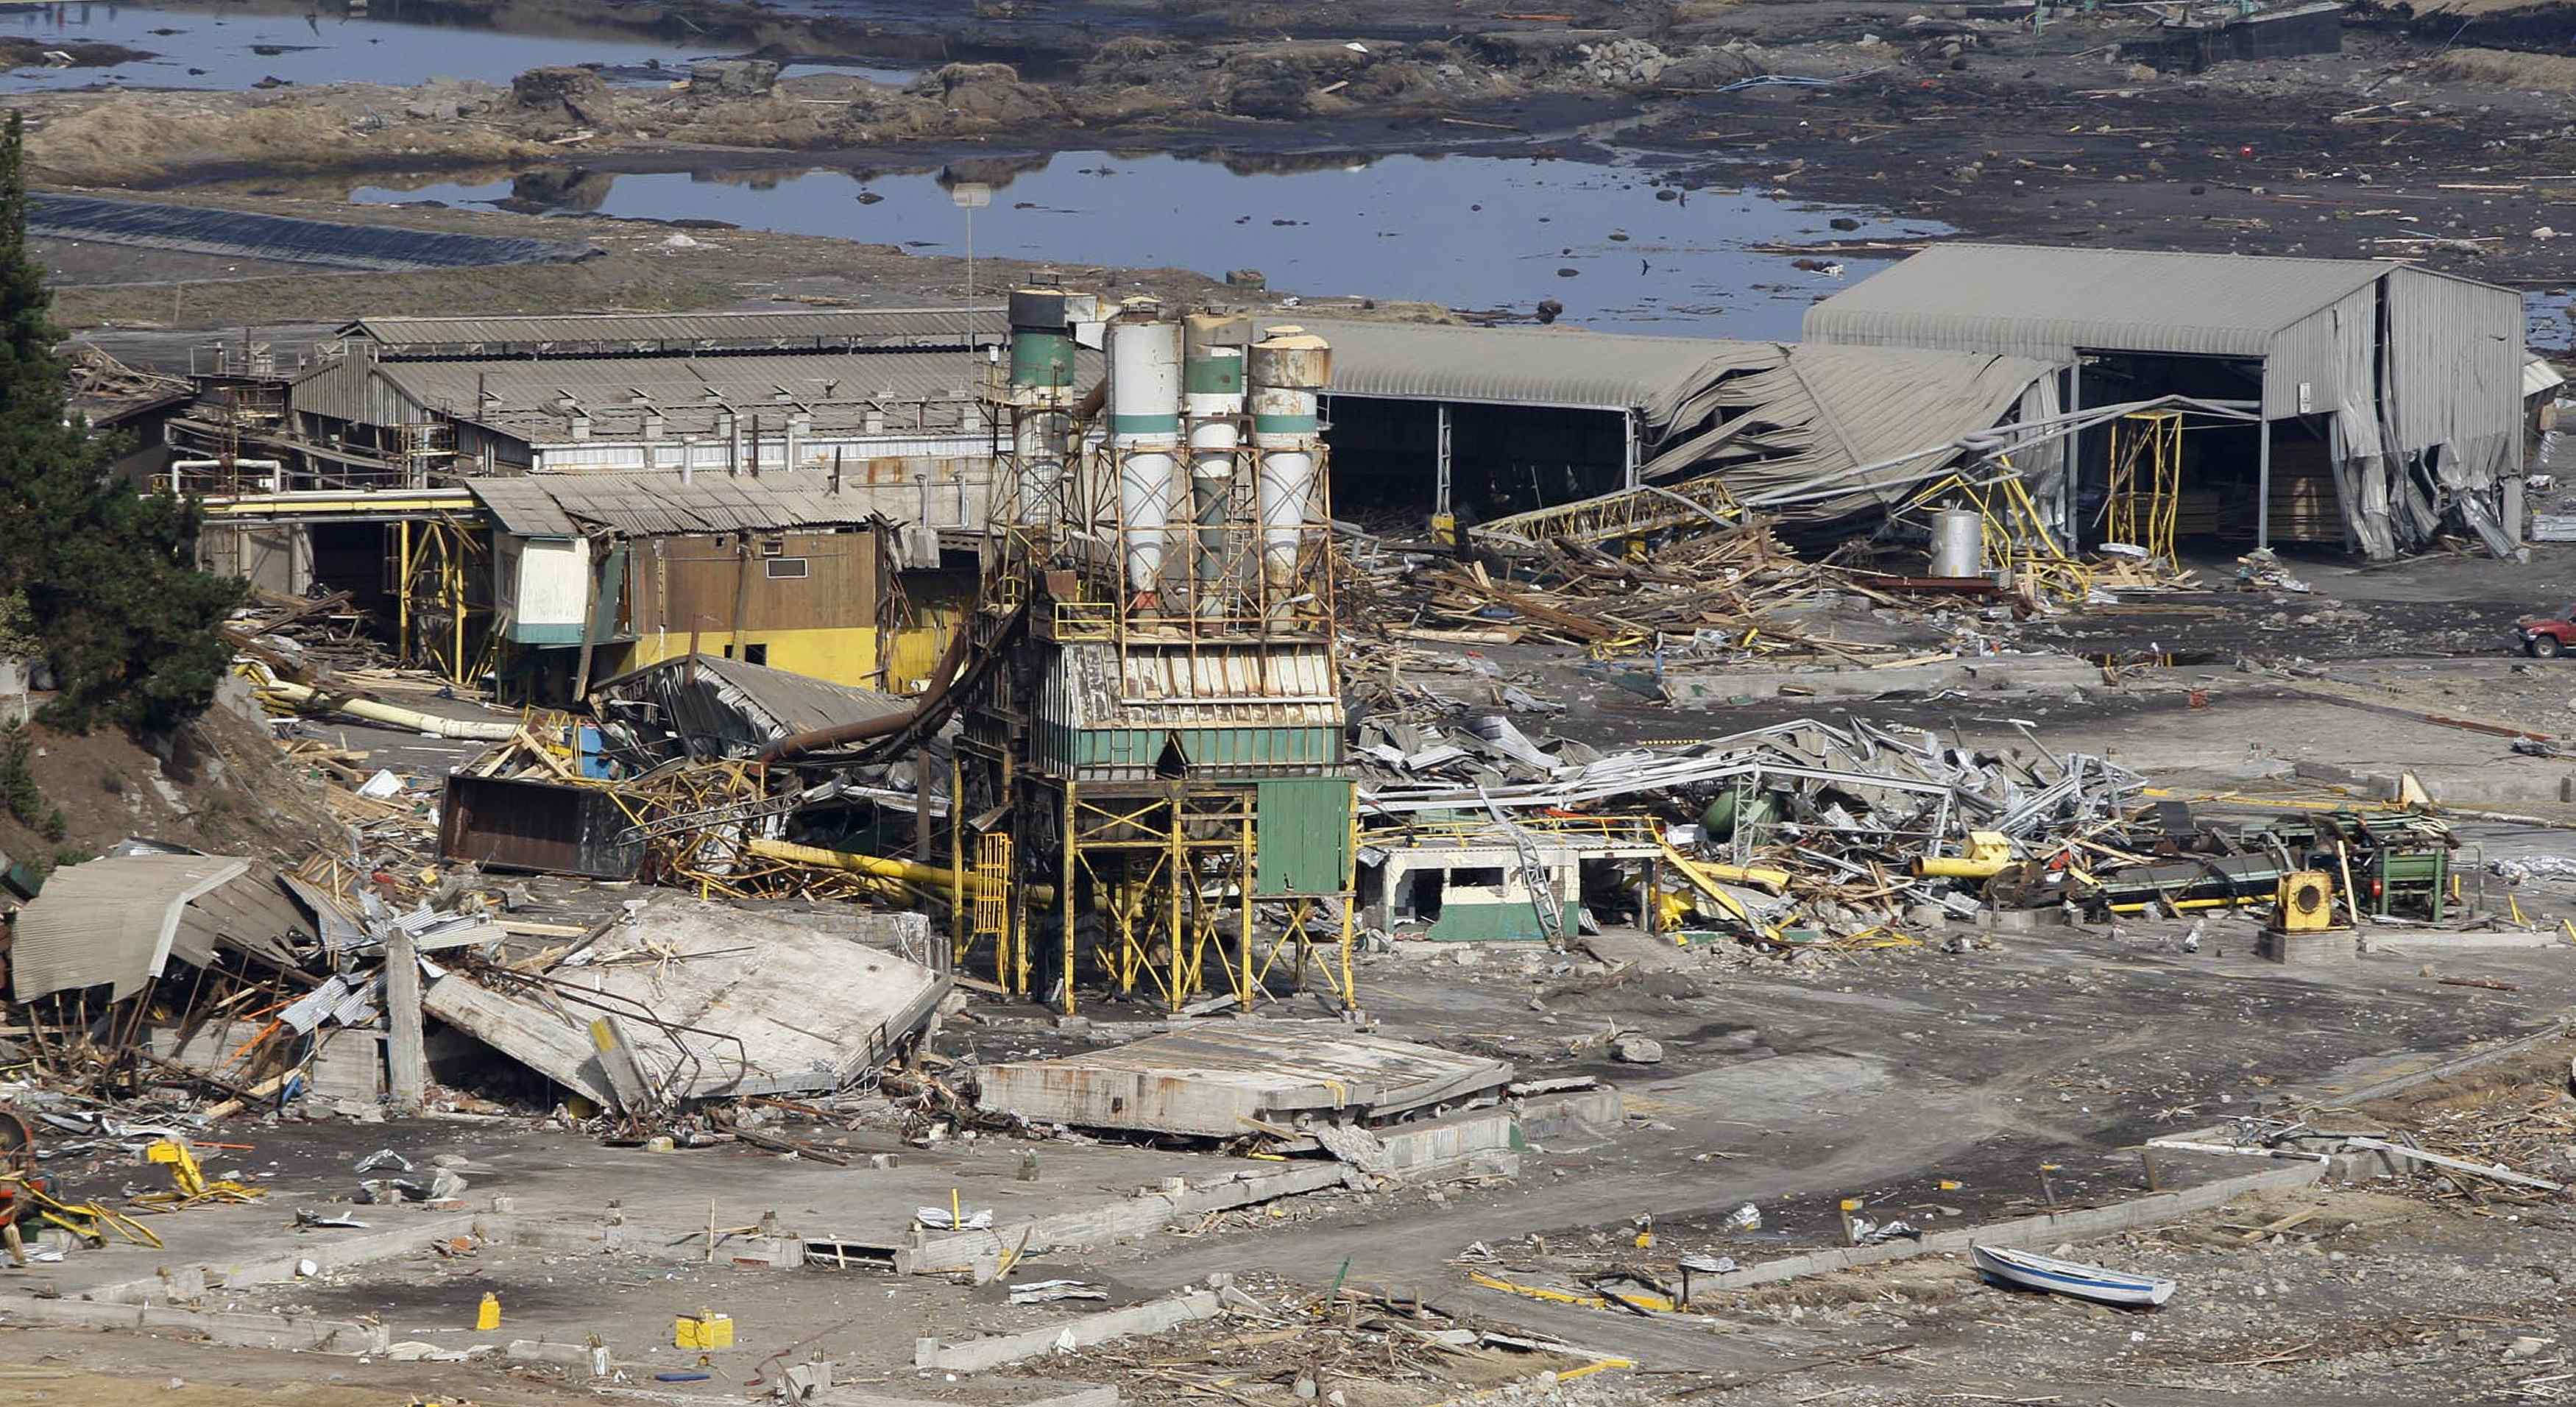
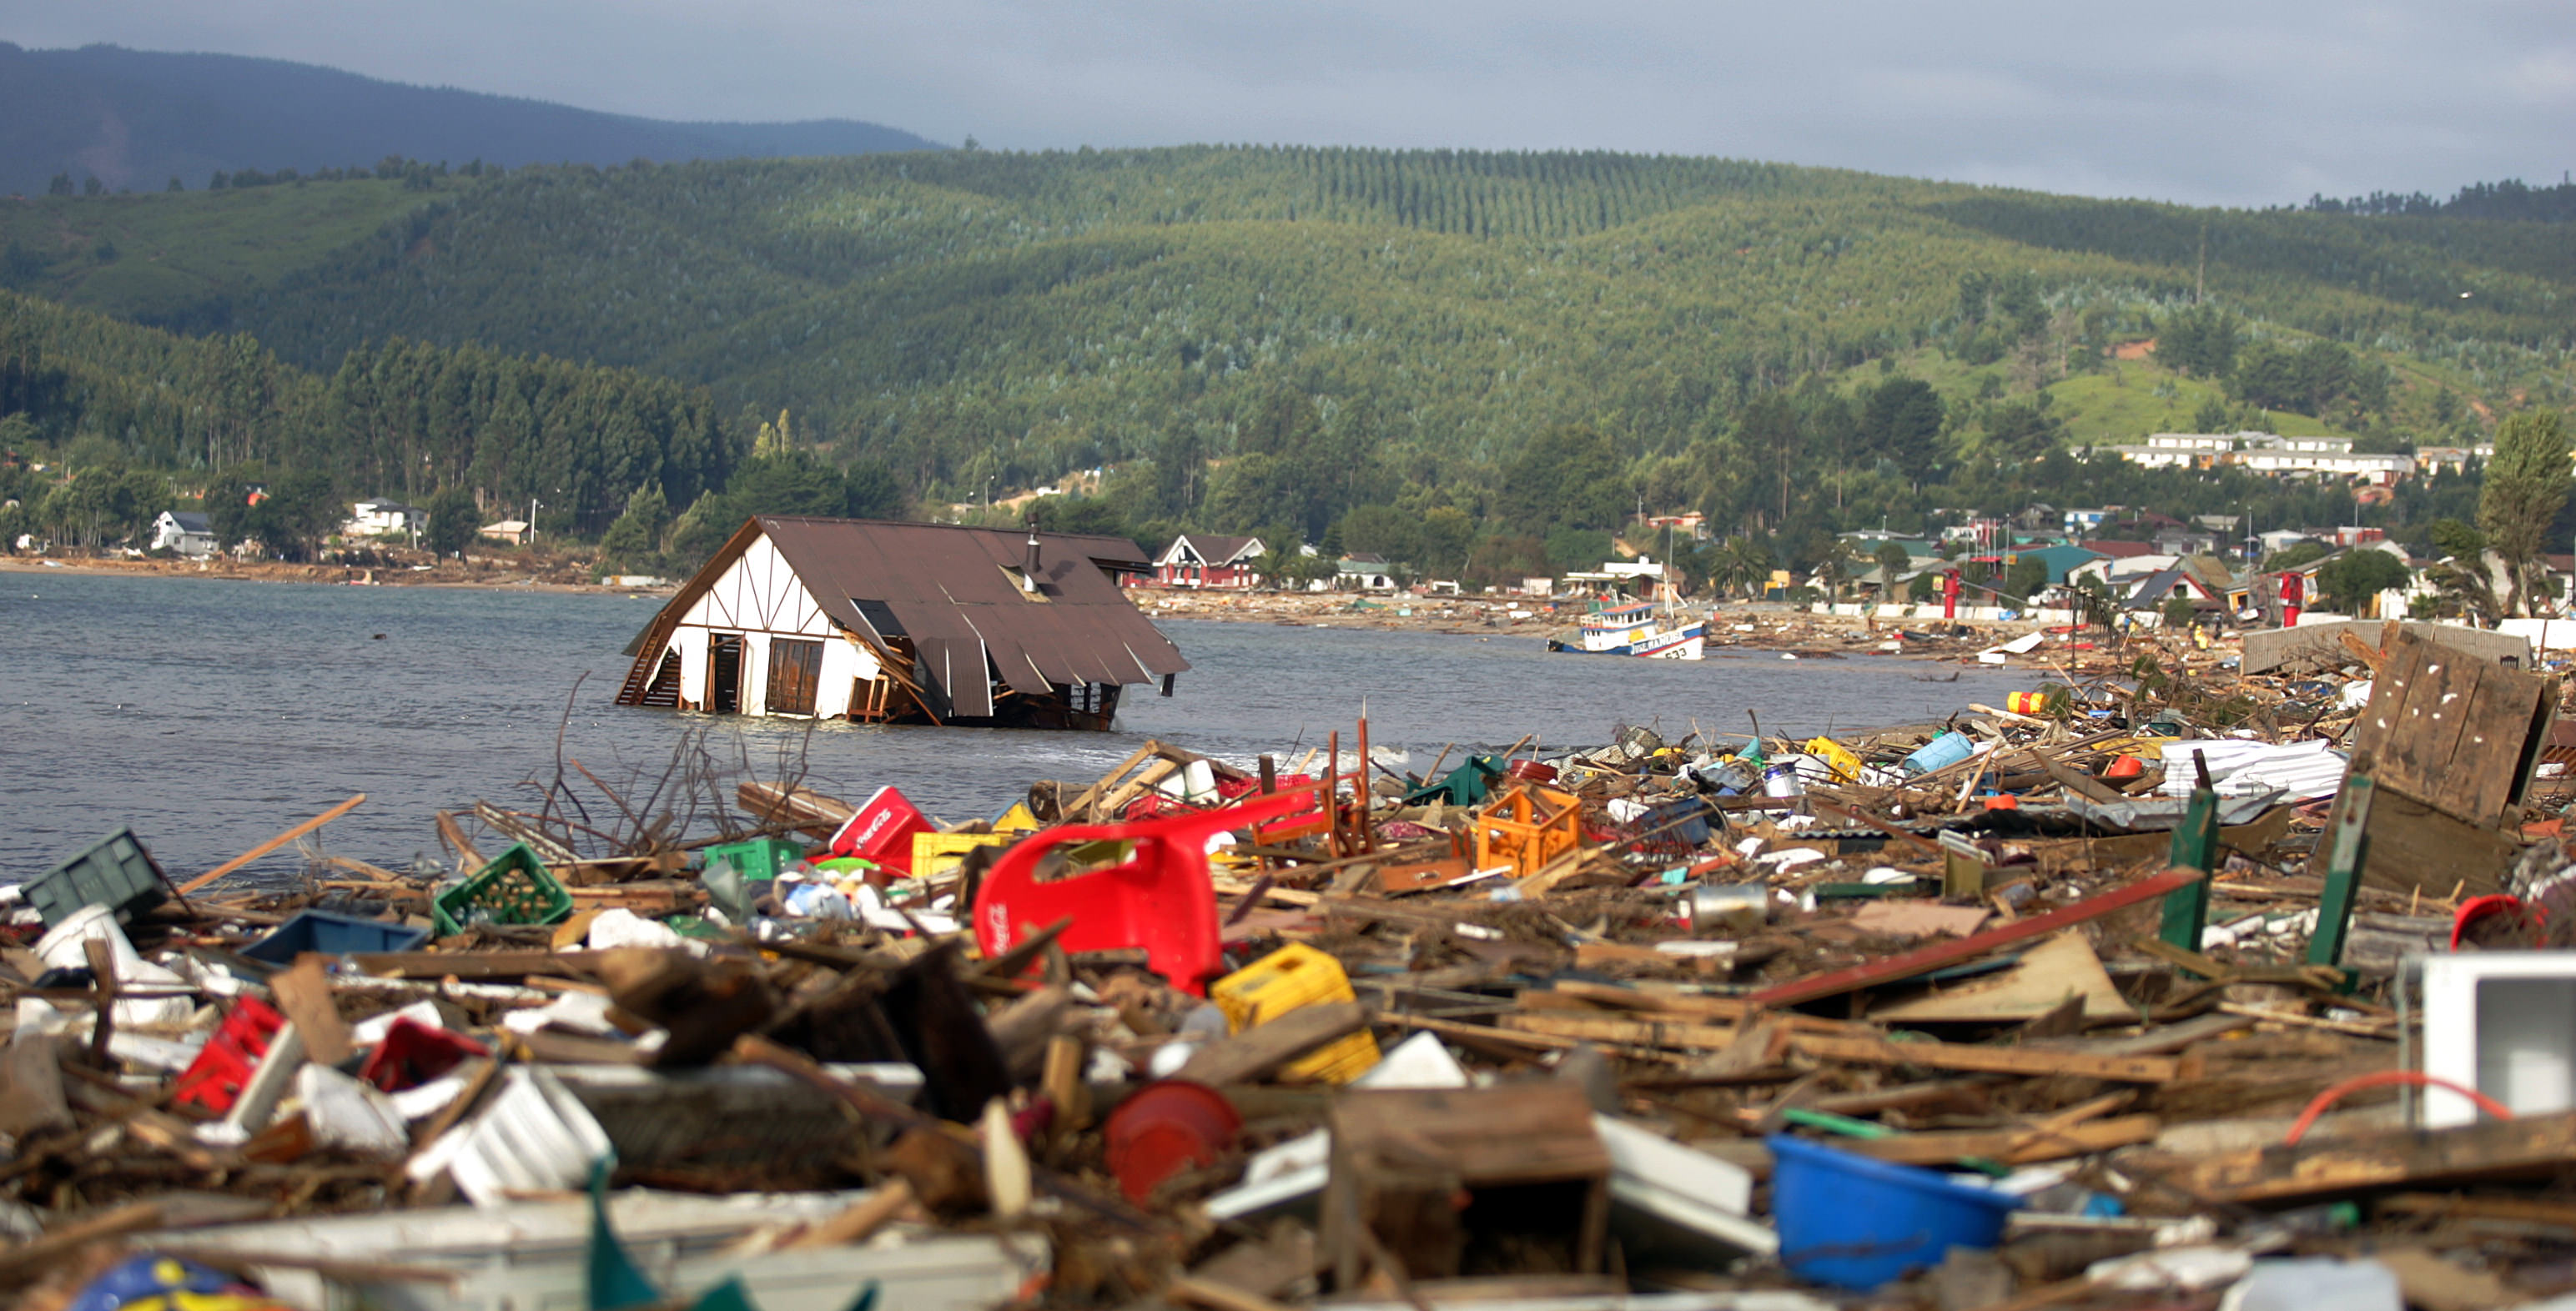
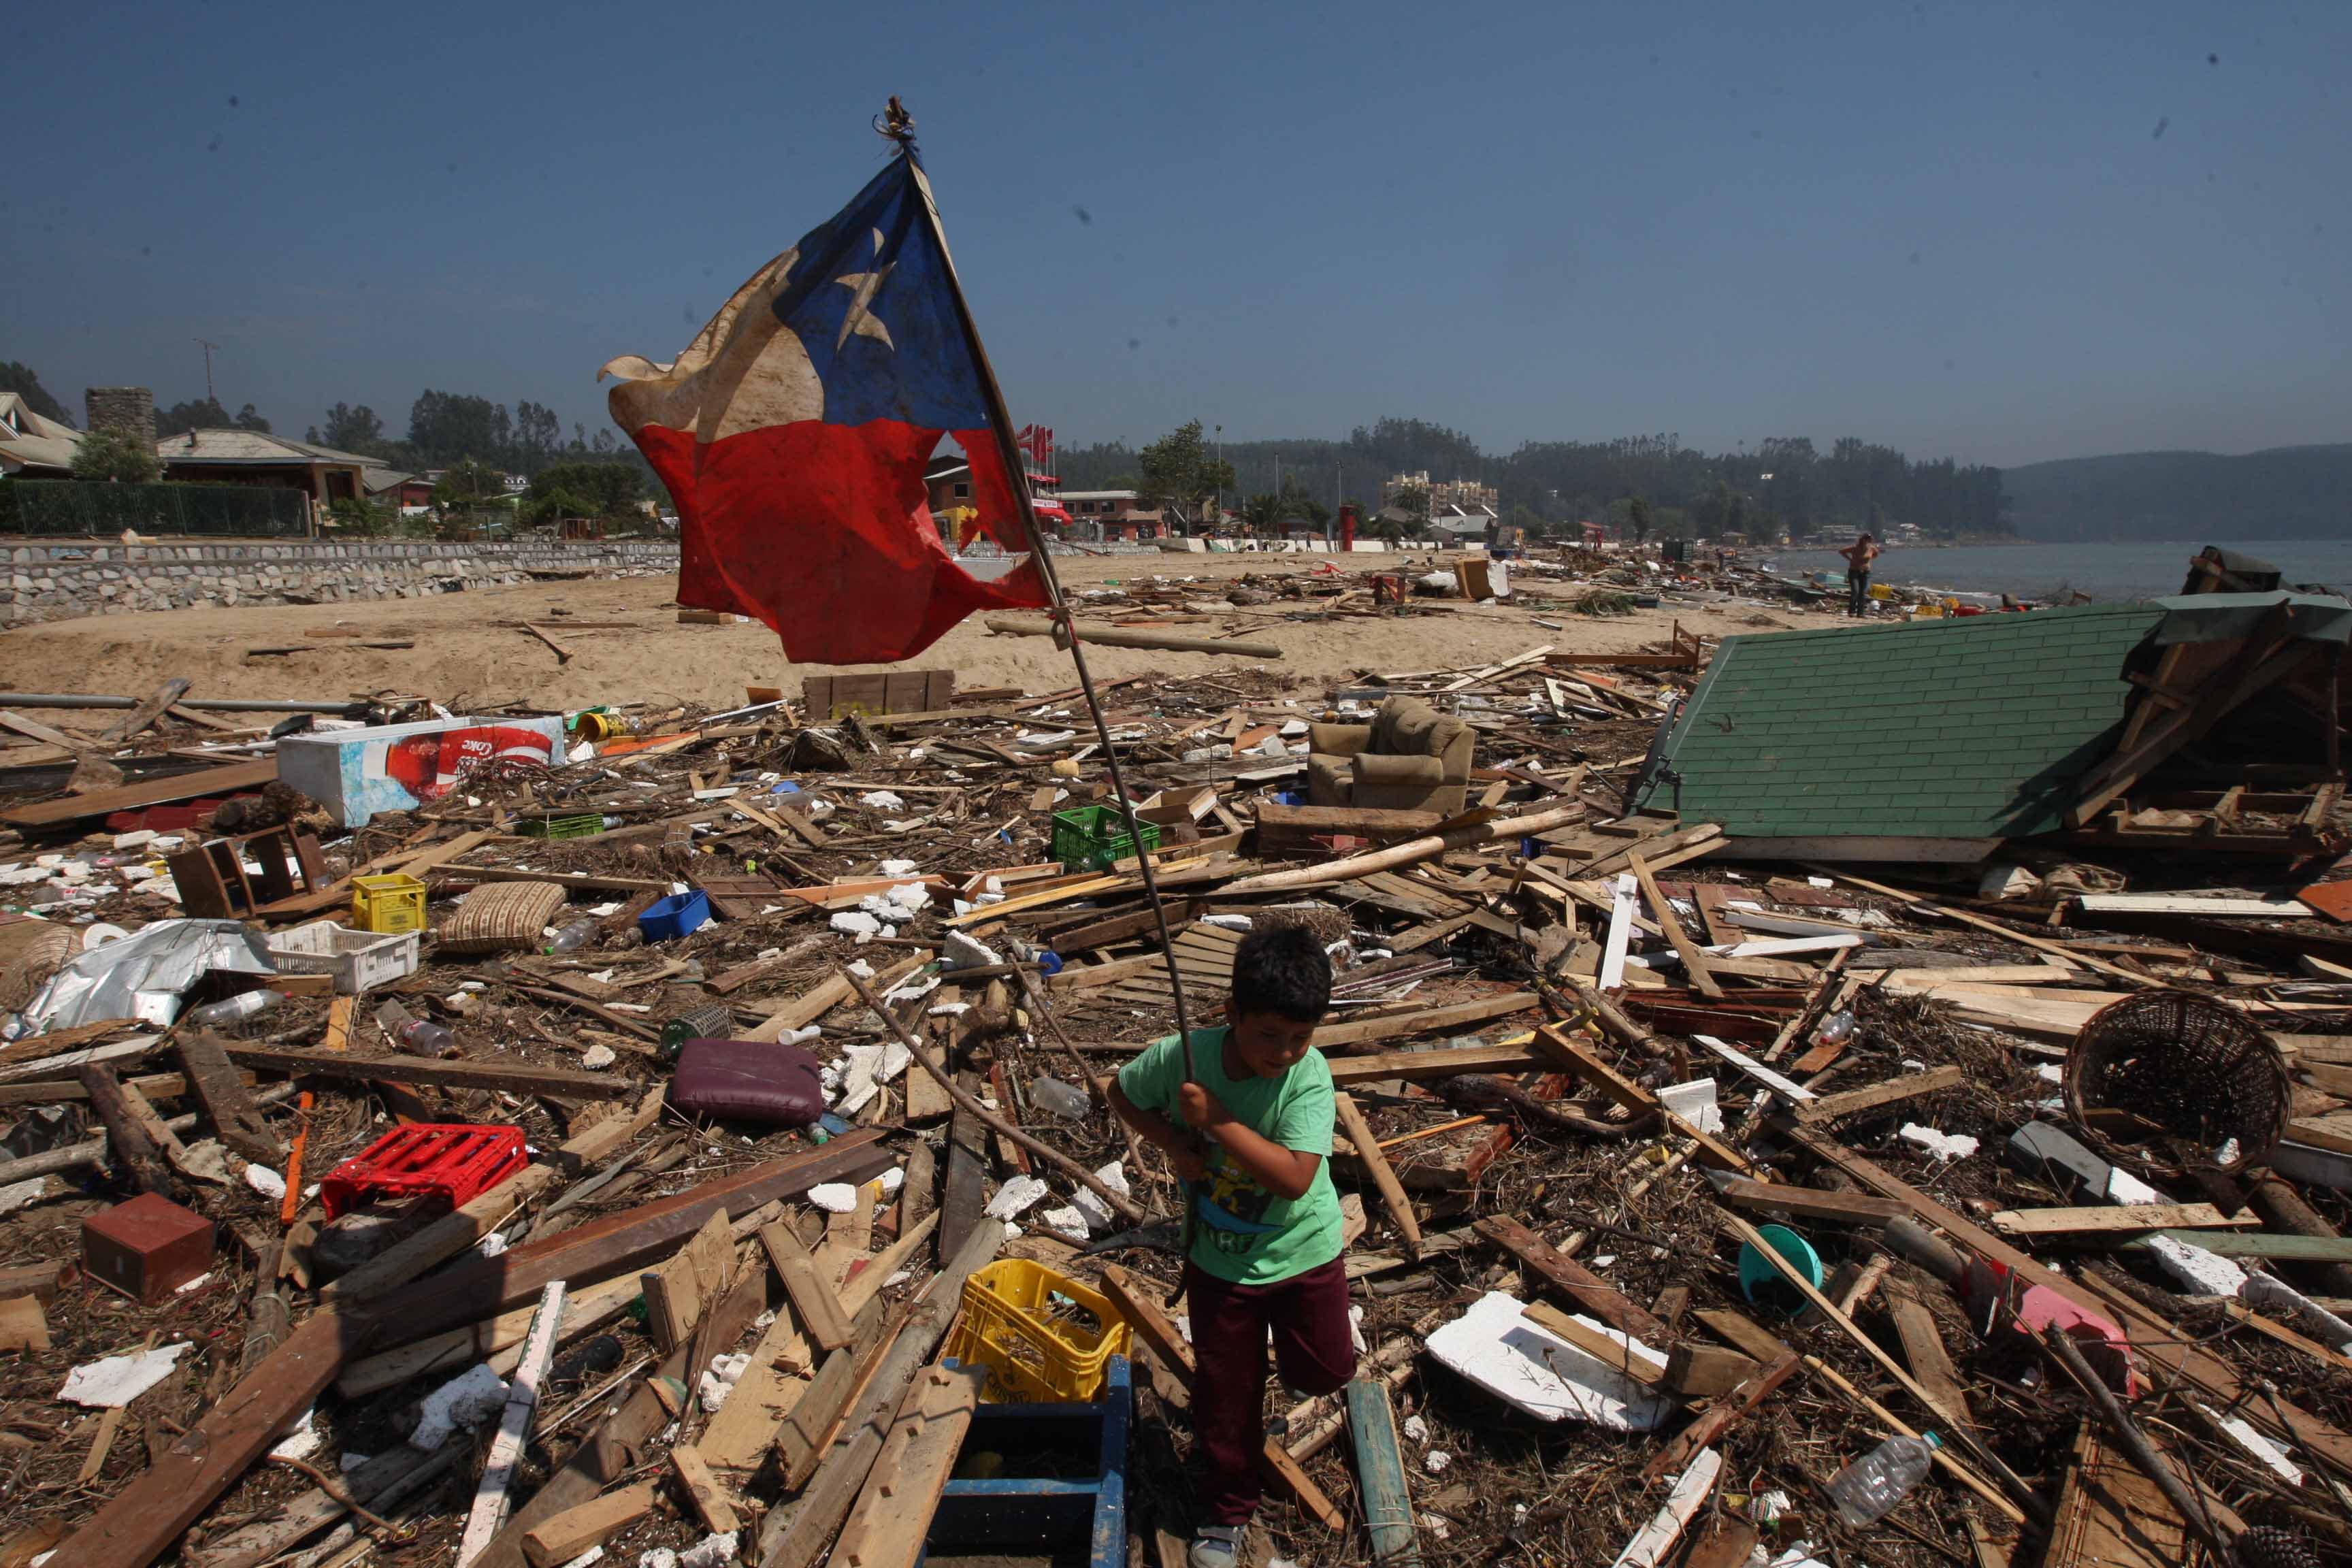
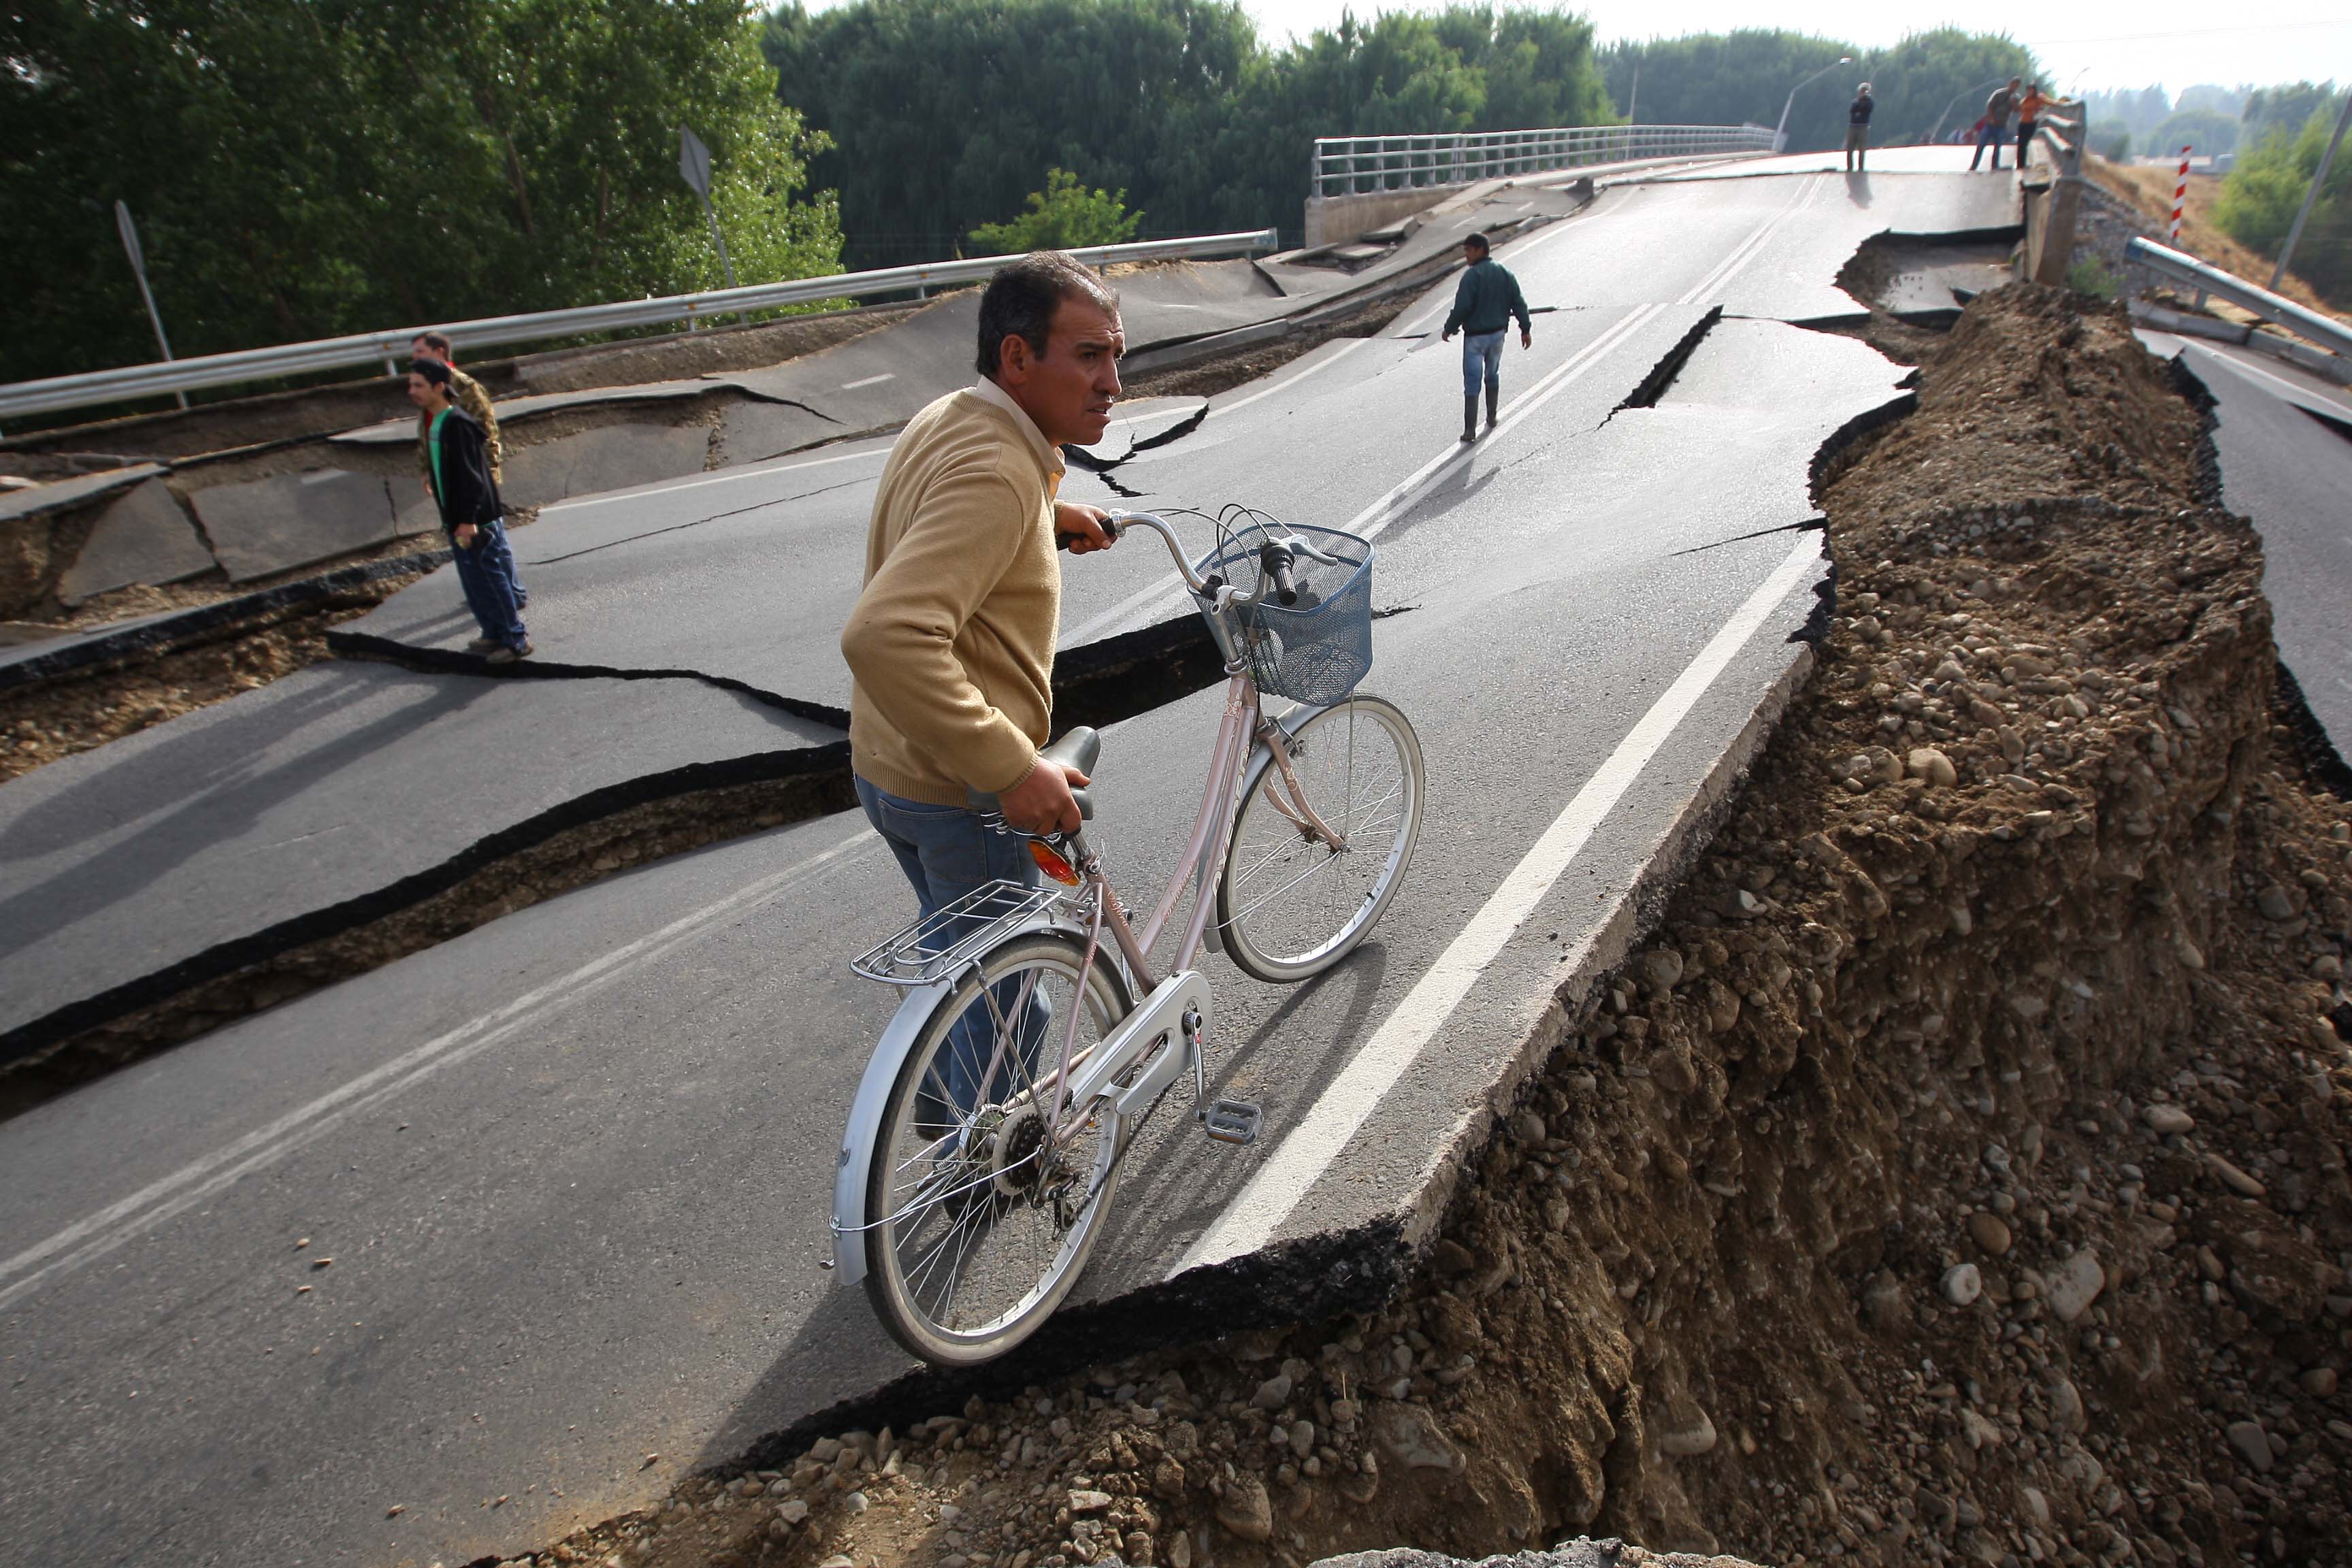
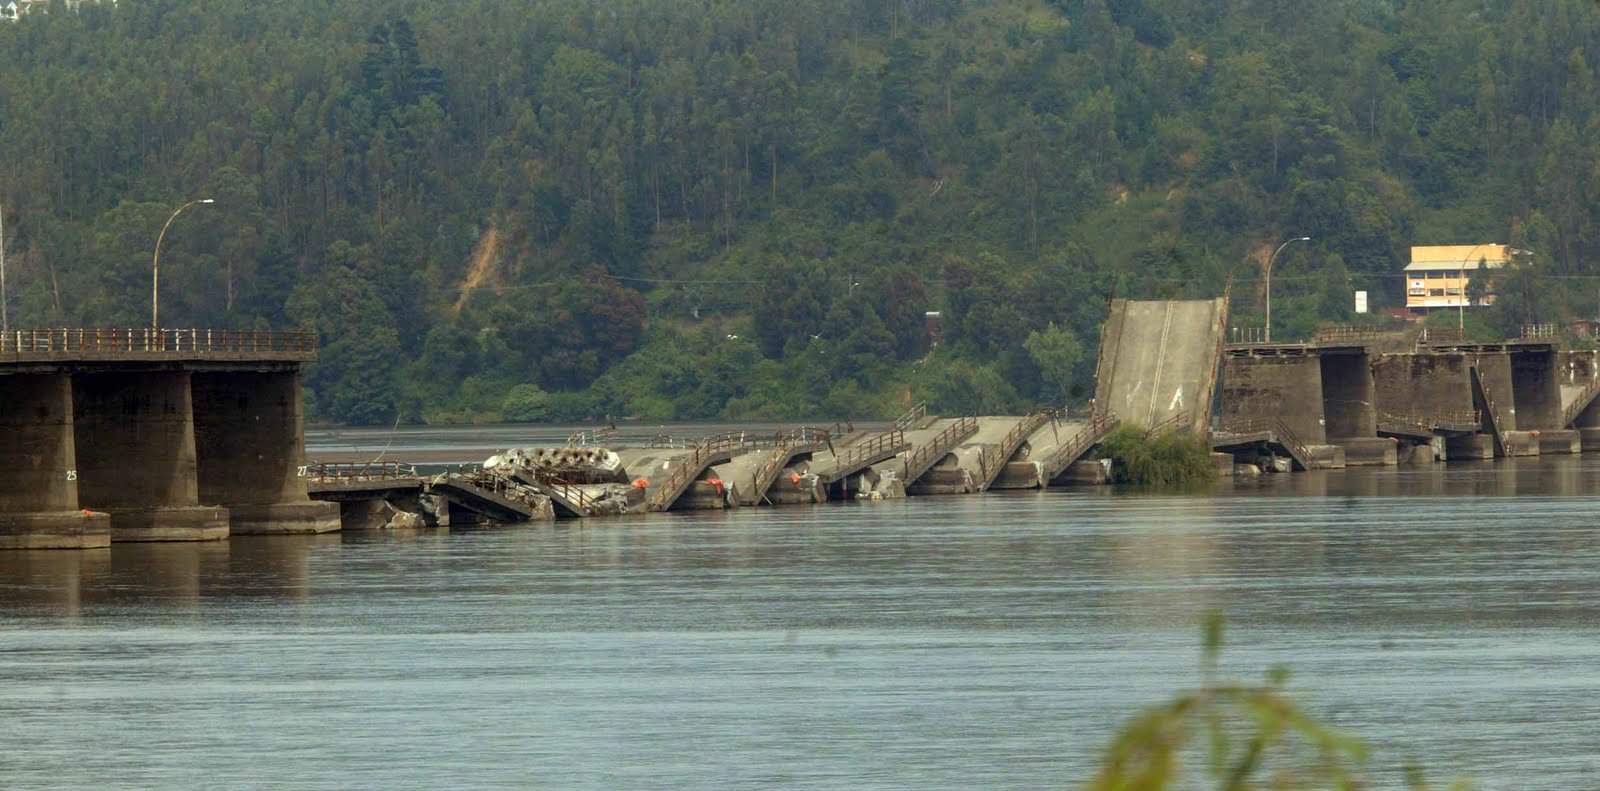
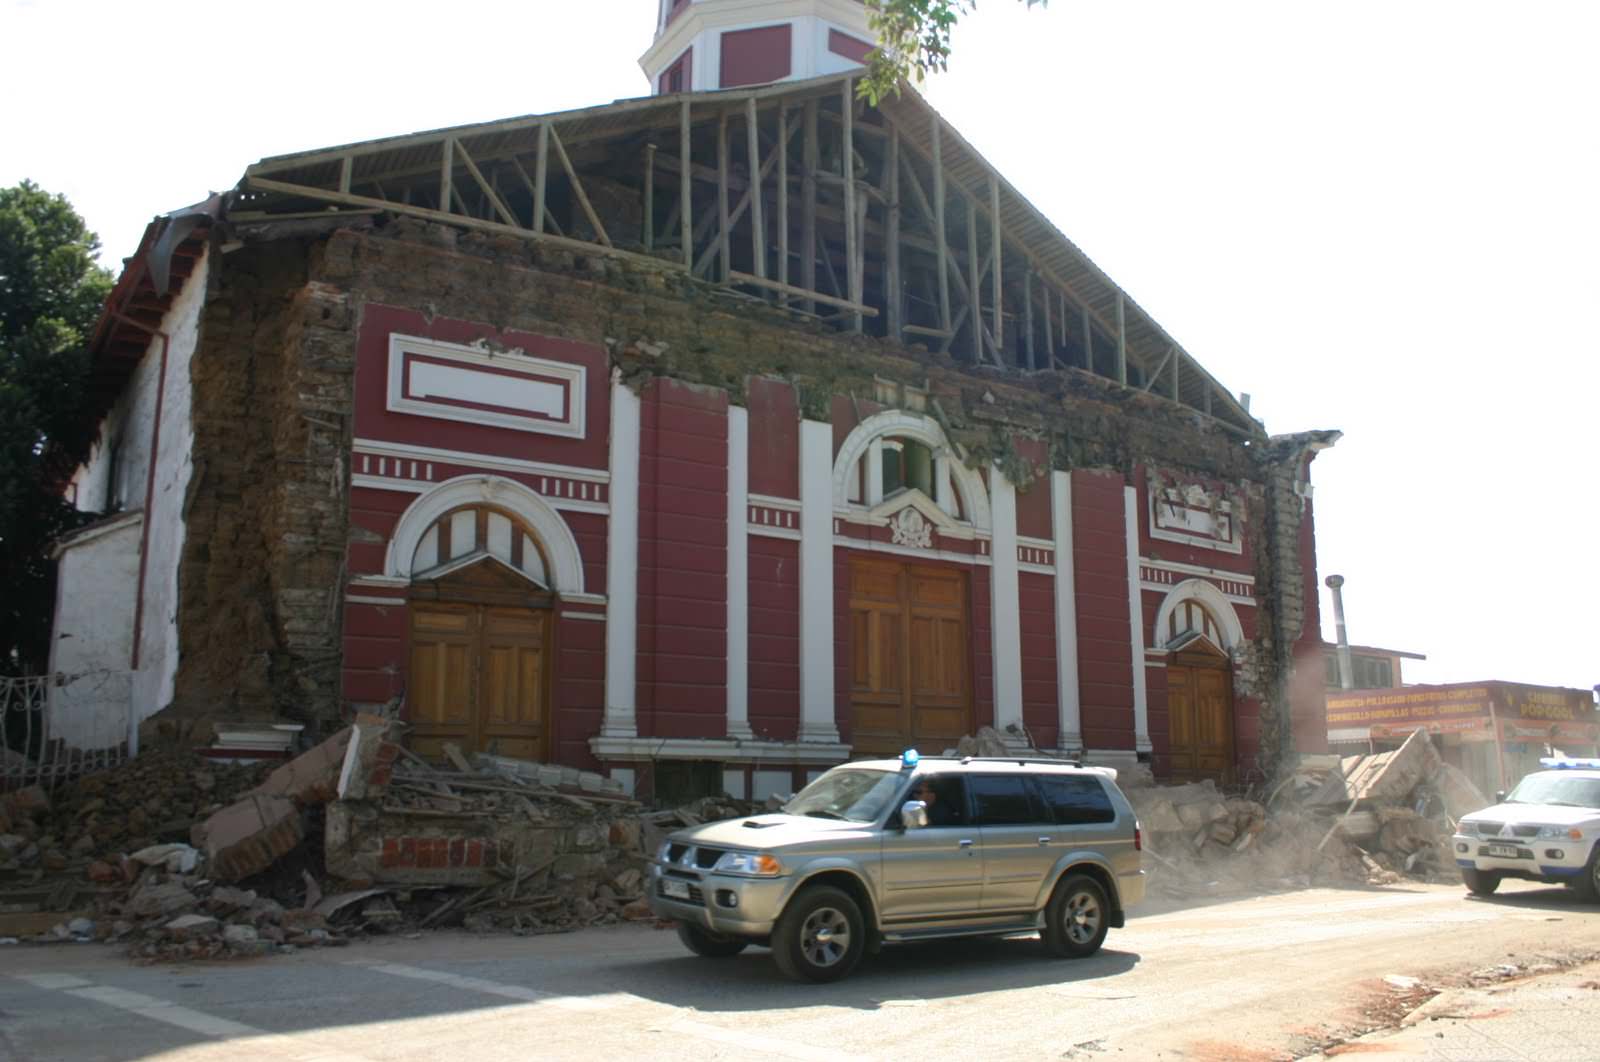
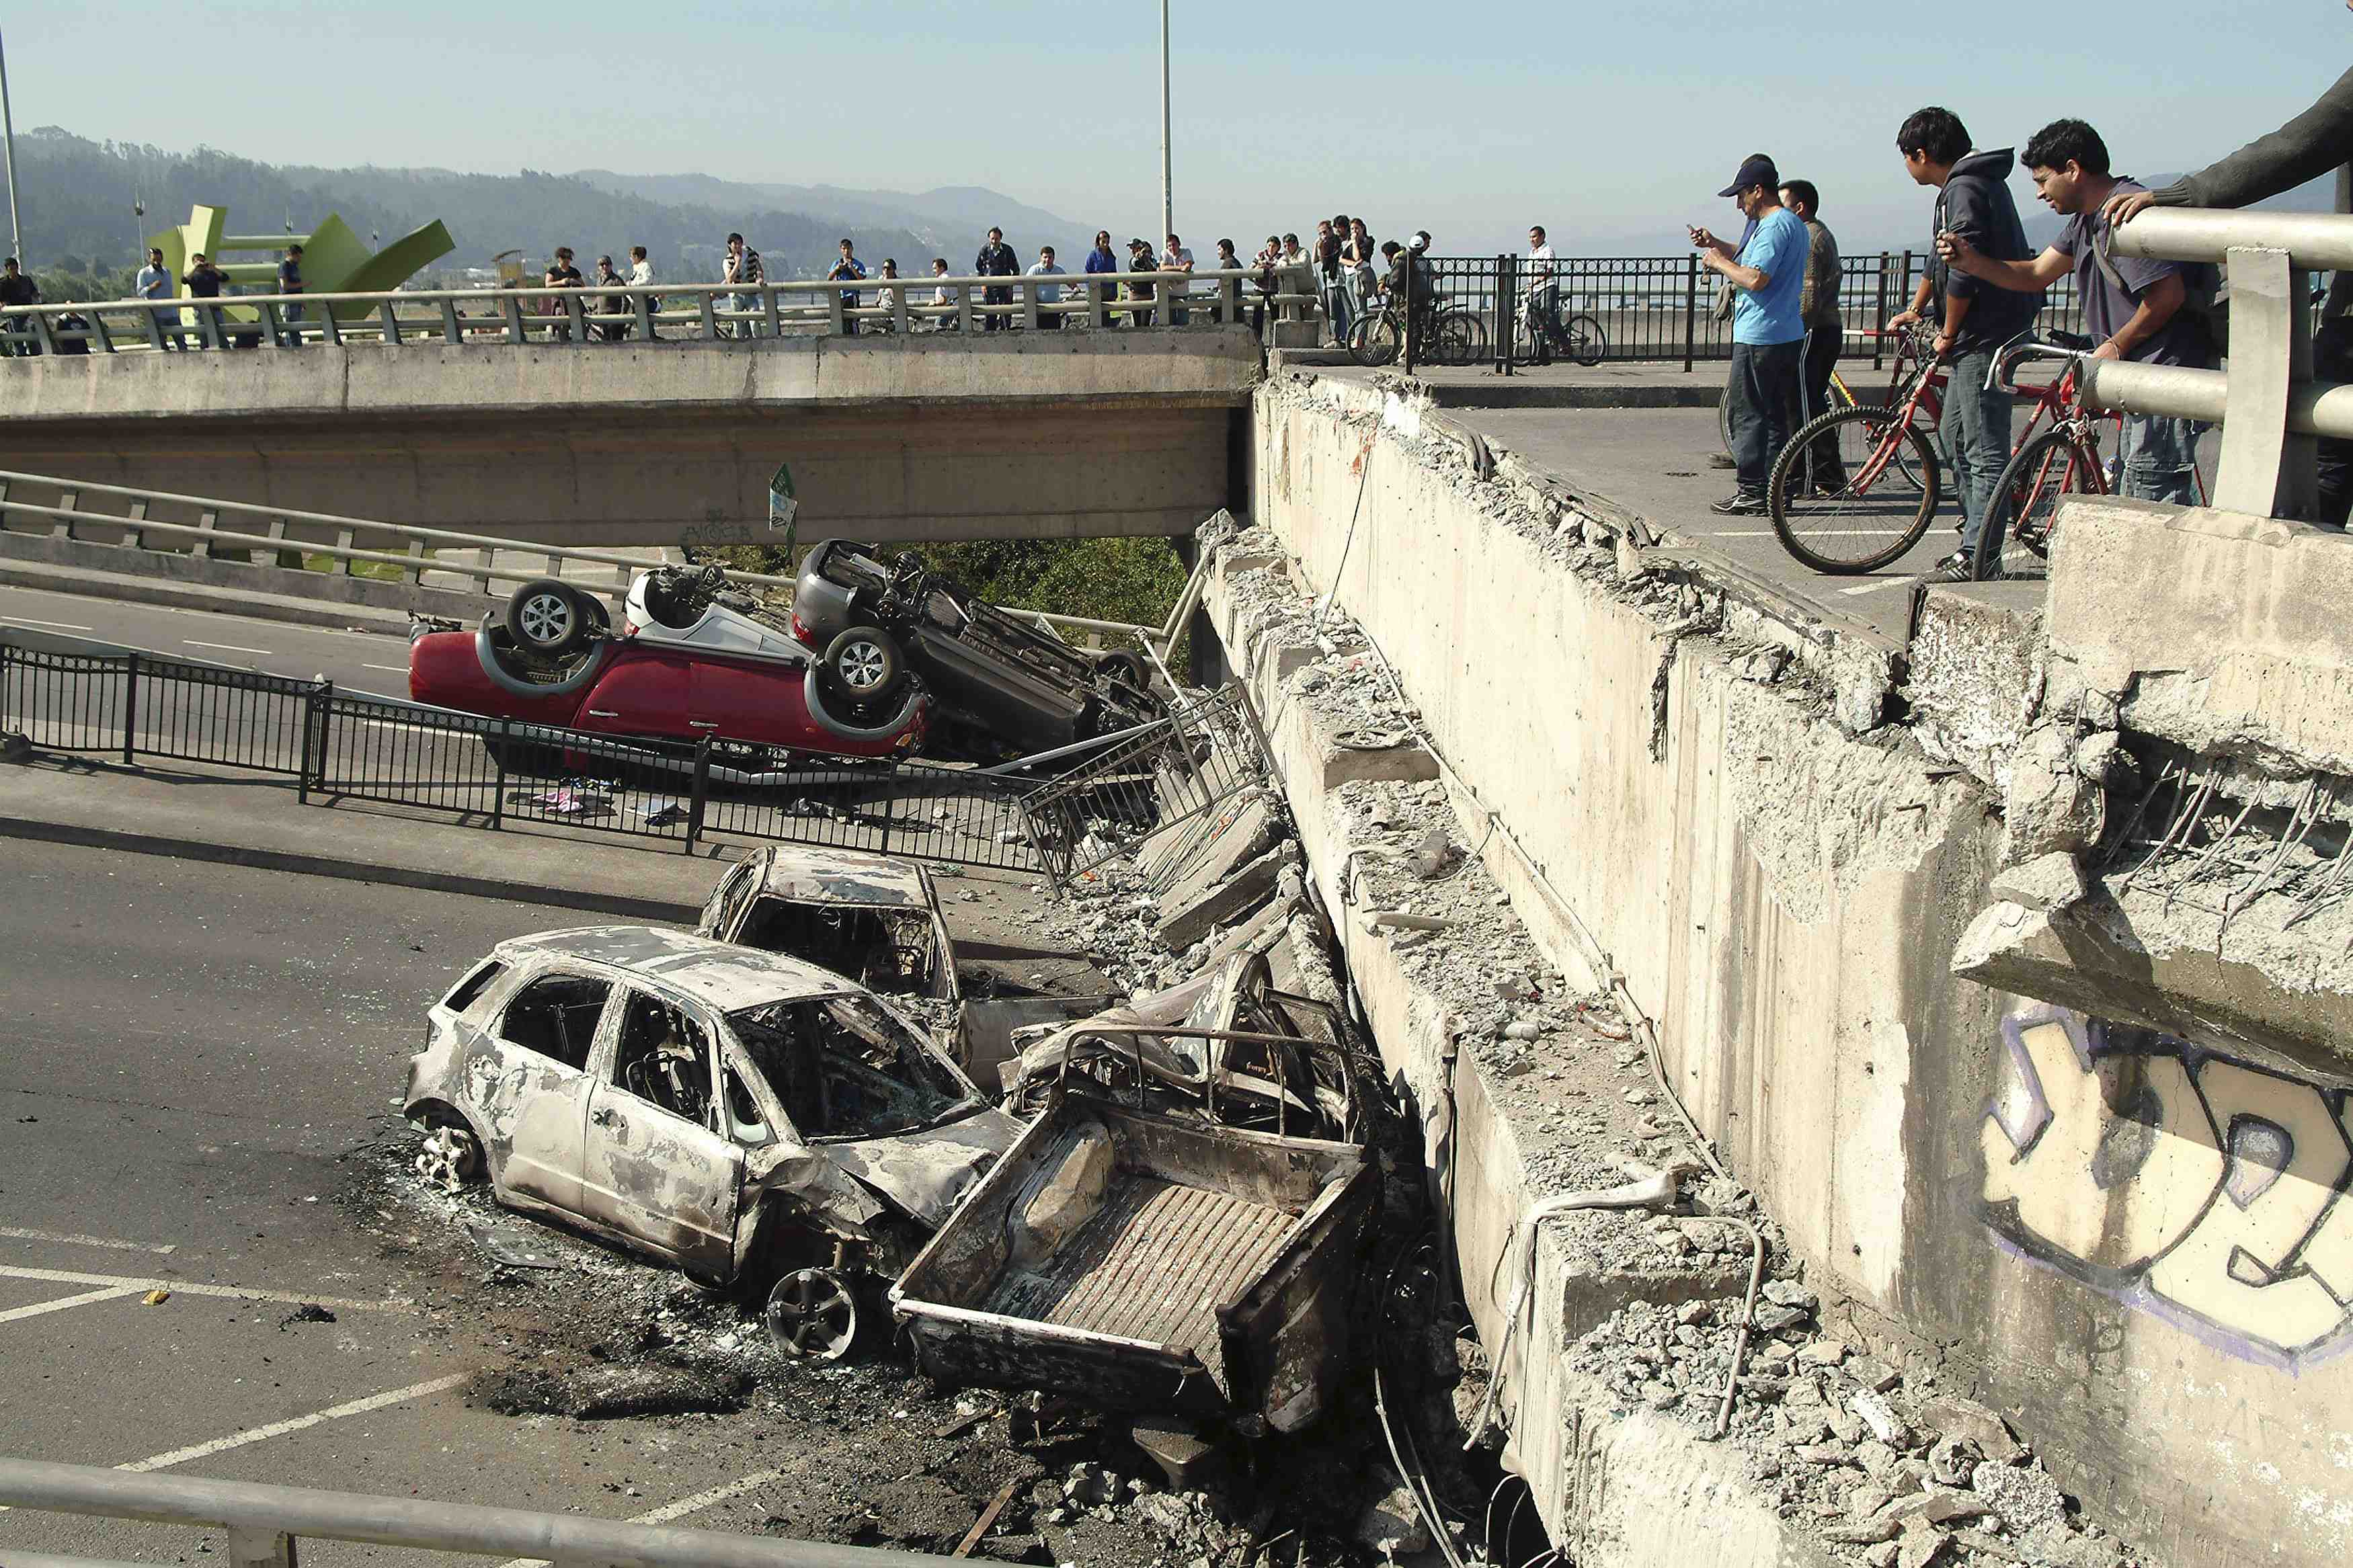
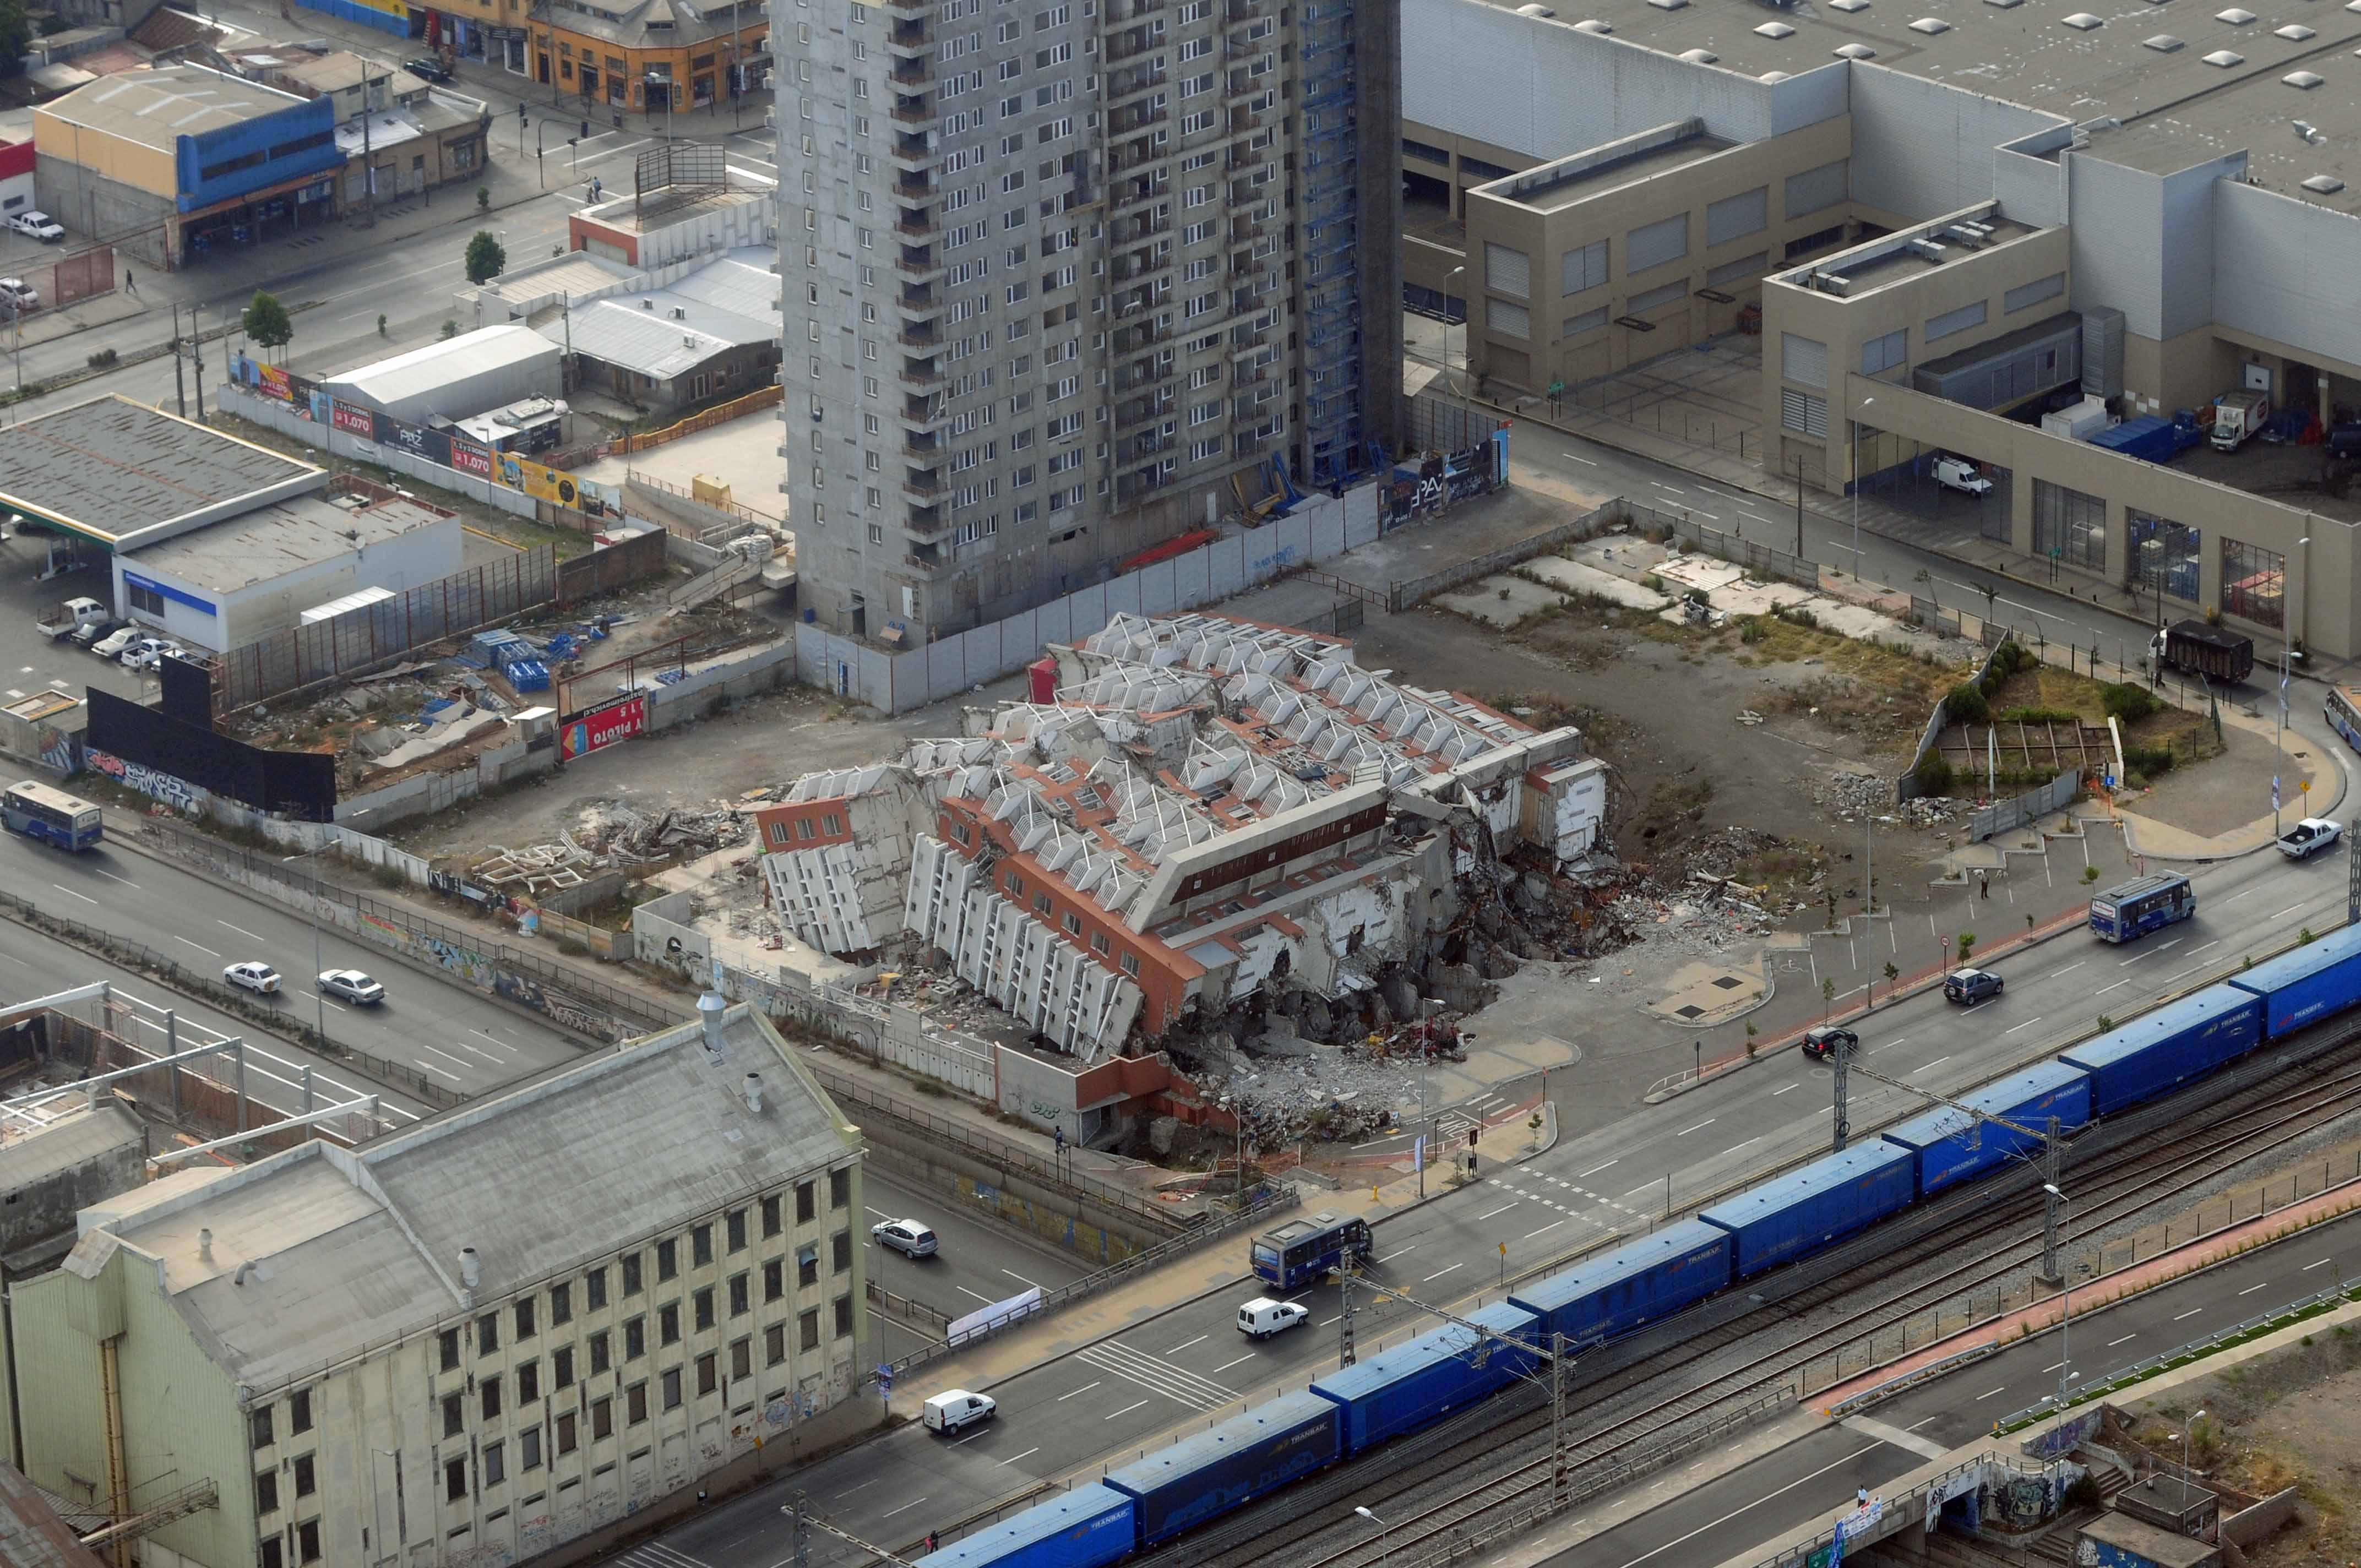
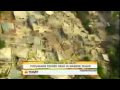
Country: Chile
[ Hazard ]
Event Date
February 27, 2010
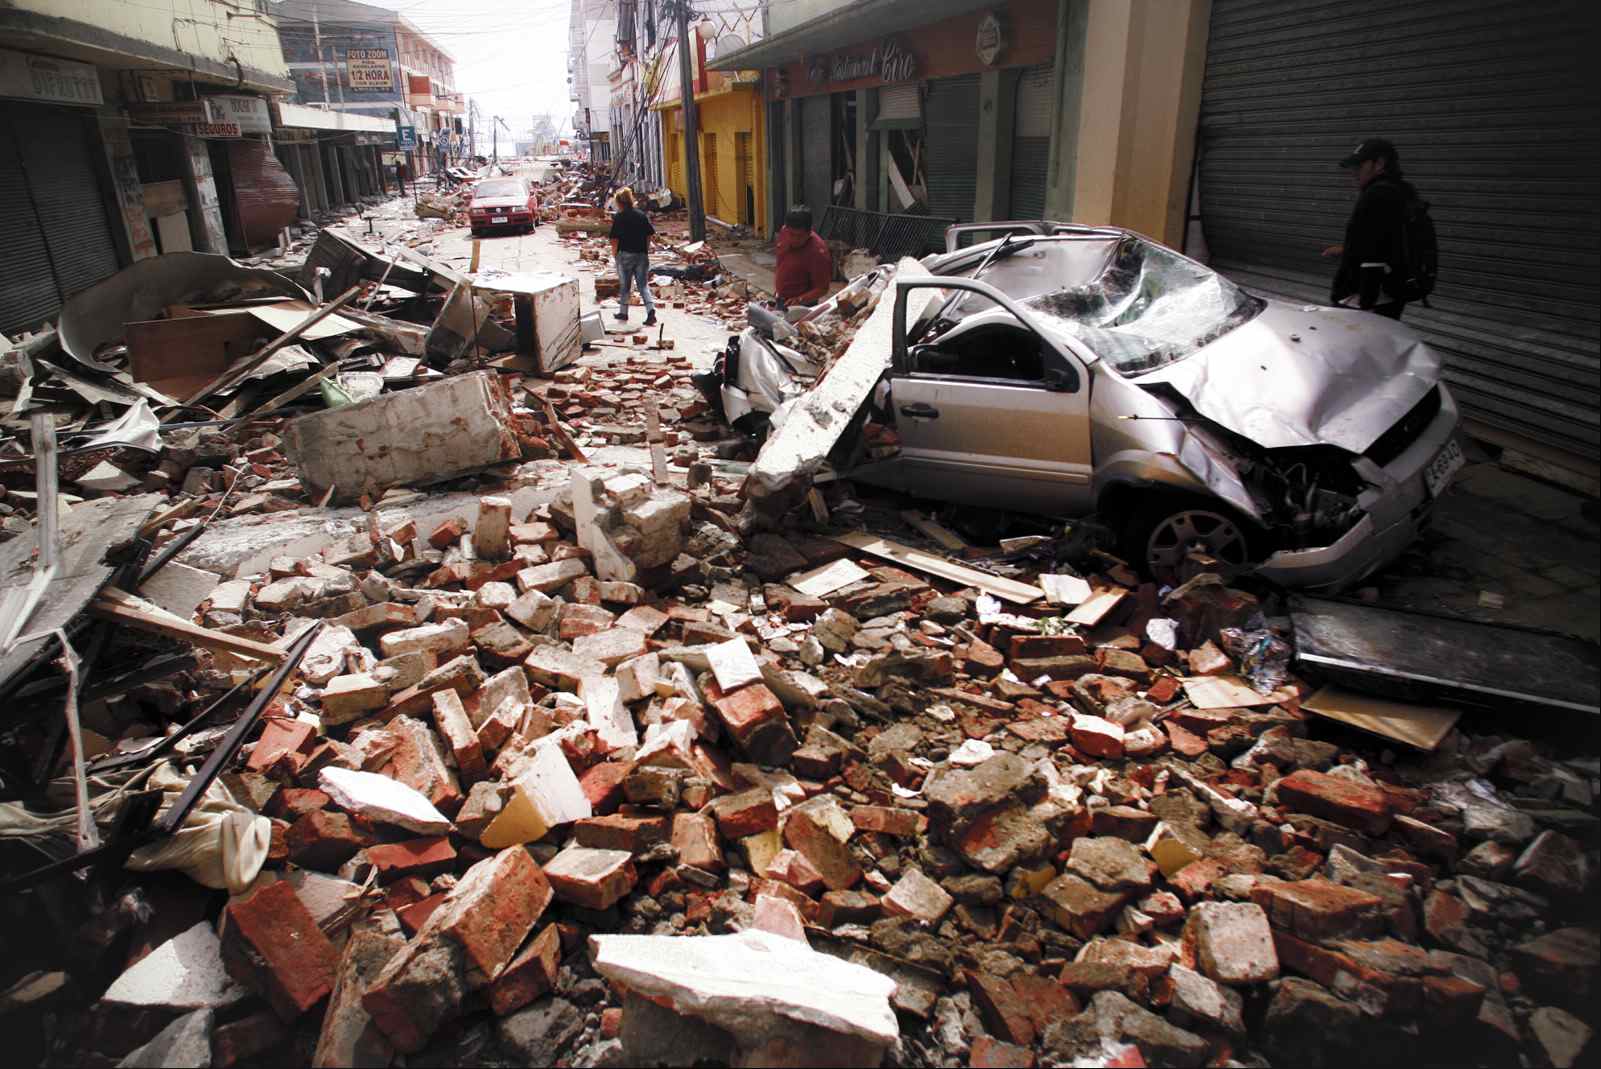
Moment Magnitude Scale (Mw)
8.8
Modified Mercalli Intensity Scale (MMI)
VIII (Severe) at Cabrero
VIII (Severe) at Arauco
VIII (Severe) at Tome
VIII (Severe) at Constitucion
VIII (Severe) at Concepcion
VIII (Severe) at Caranilahue
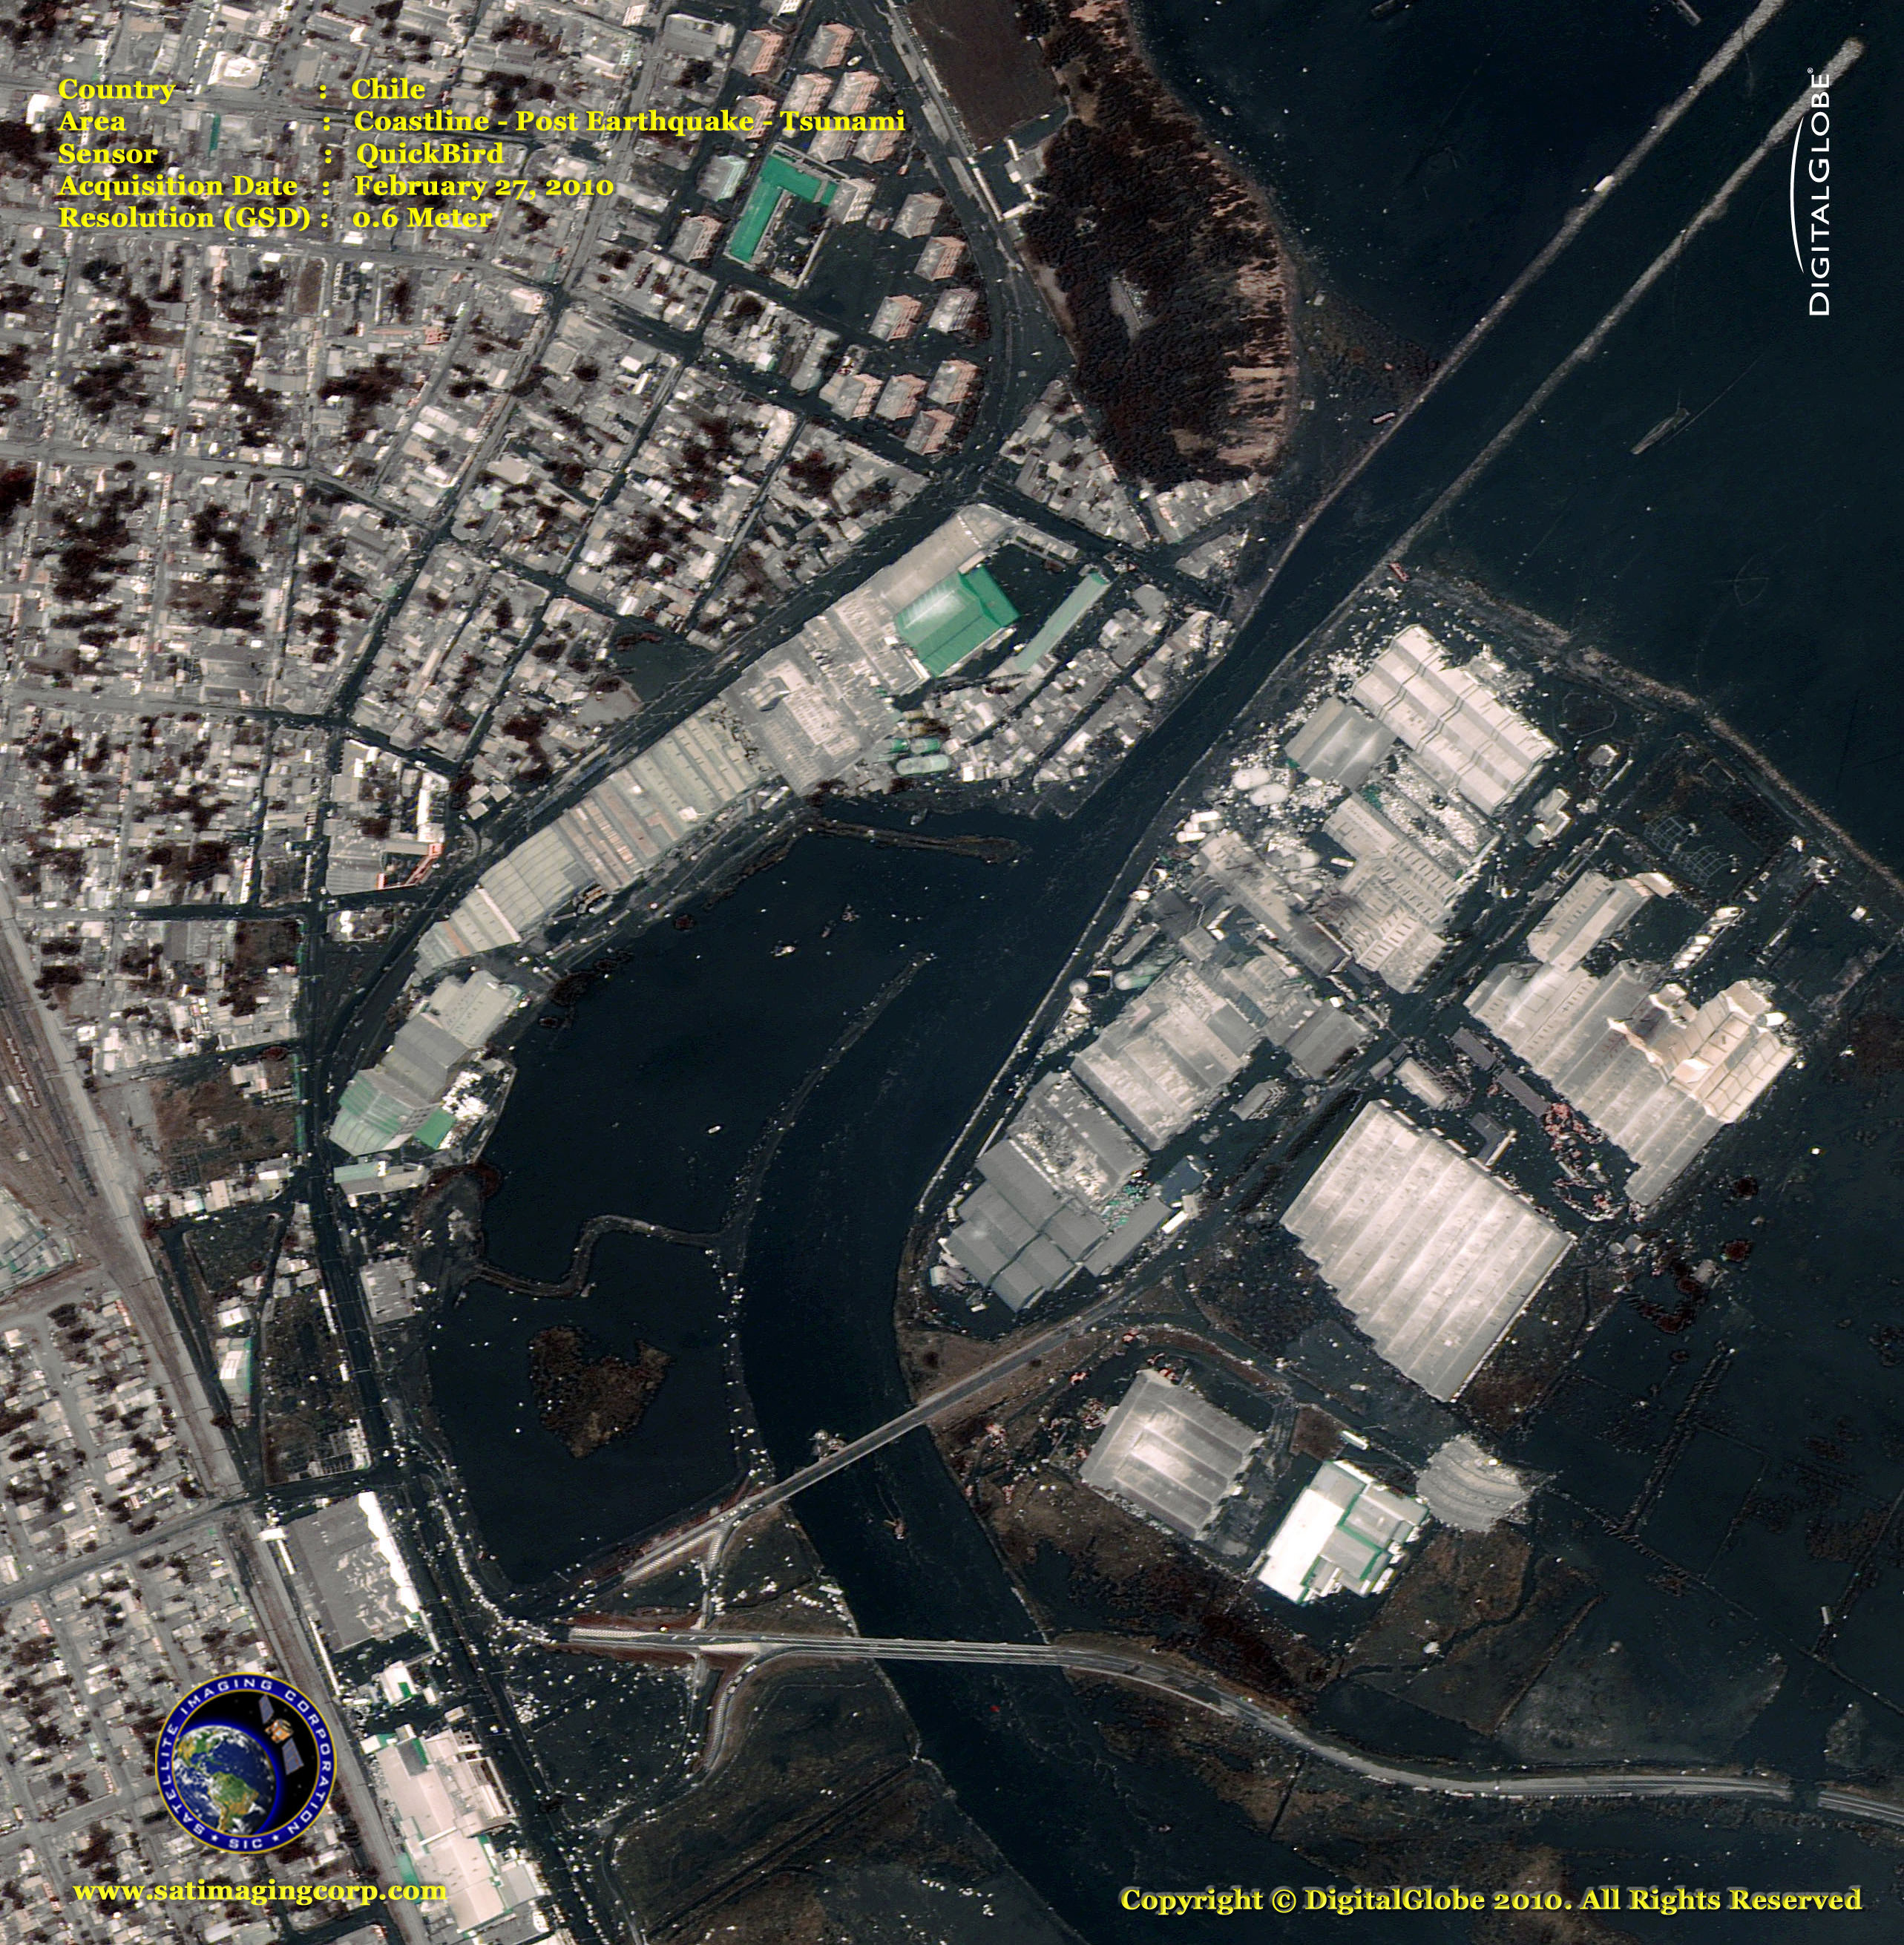
Notable Features
• Depth: 21.7 miles (35 km)
• Time: 06:34:14 UTC
• Epicenter: 35.909°S, 72.733°W, 65 miles (105 km) NE of Concepcion, Chile
• Tectonic Feature: Nazca and South American Plates
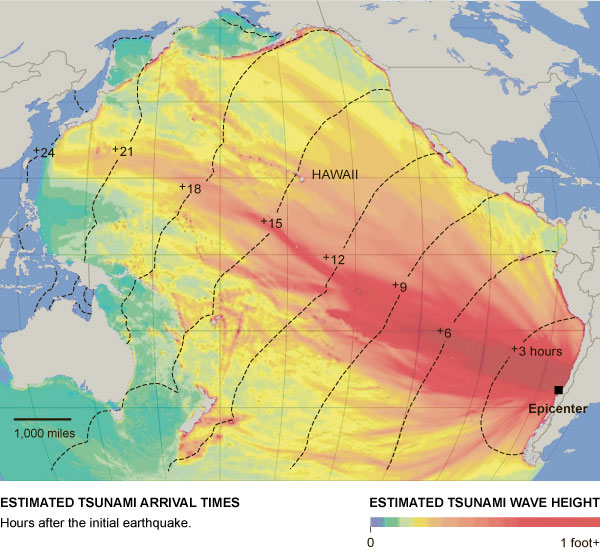
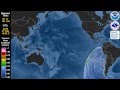
• Tsunami - Maximum Wave Height: 8.50 feet above sea level recorded in Valparaiso.
Source(s)
• US Geological Survey
Videos[ Exposures ]
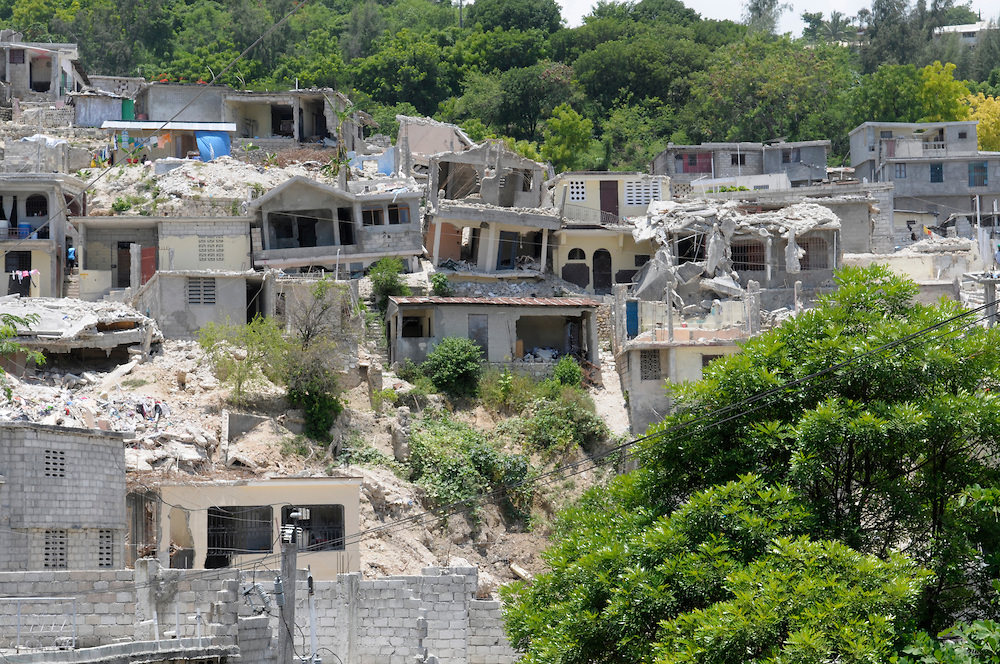
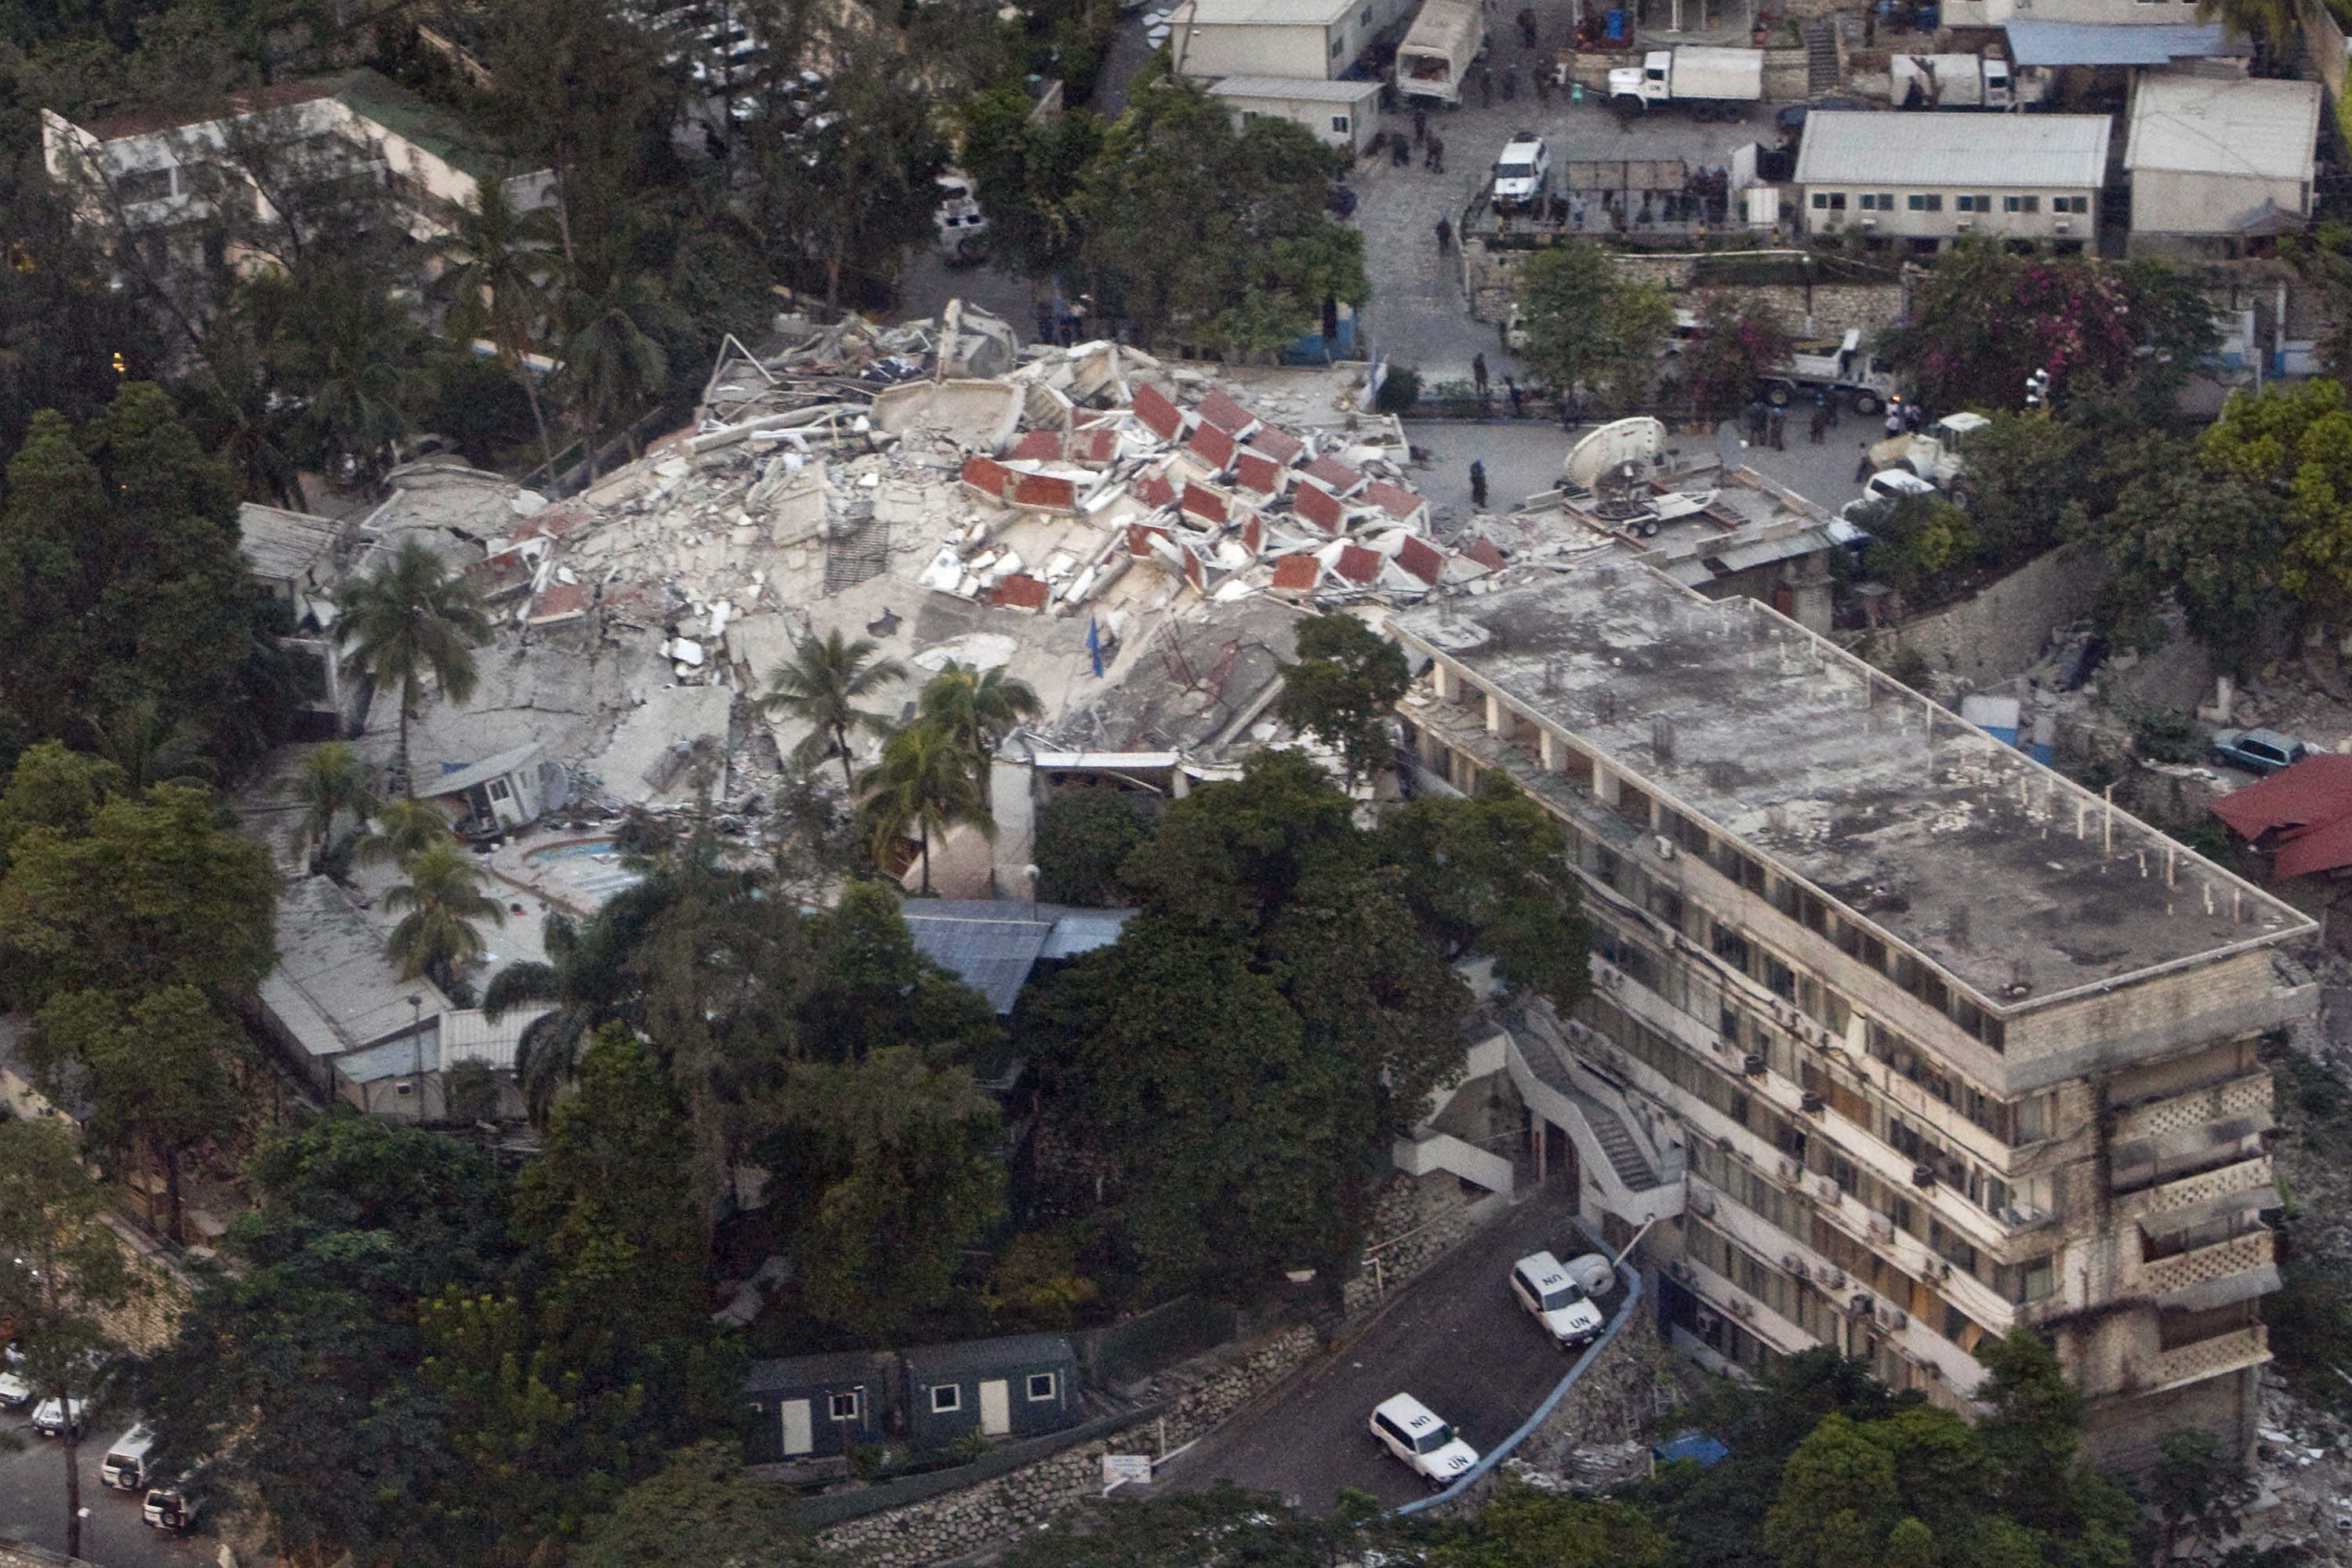
Principal Area of Impact
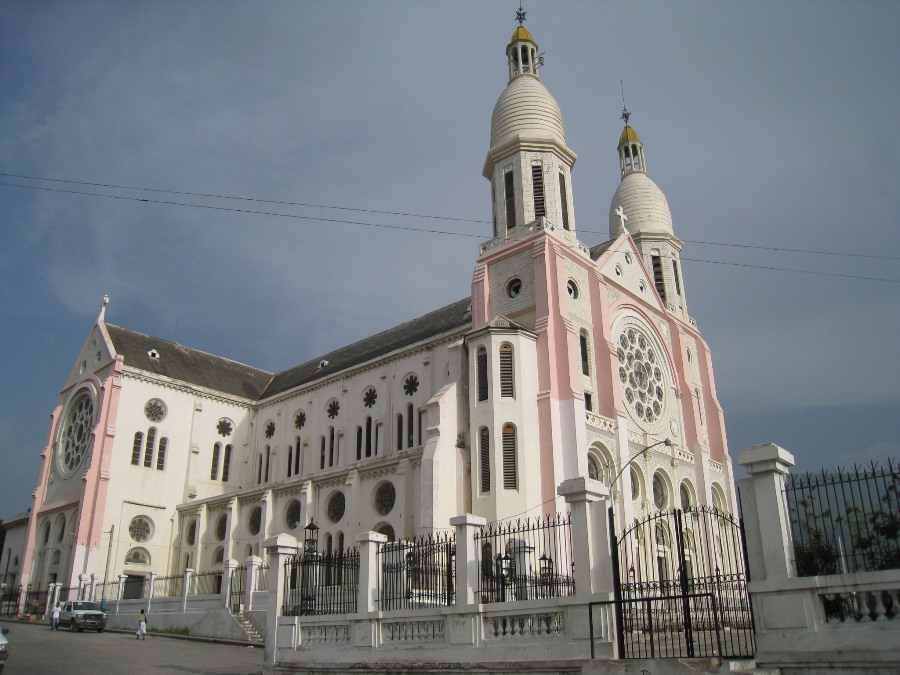
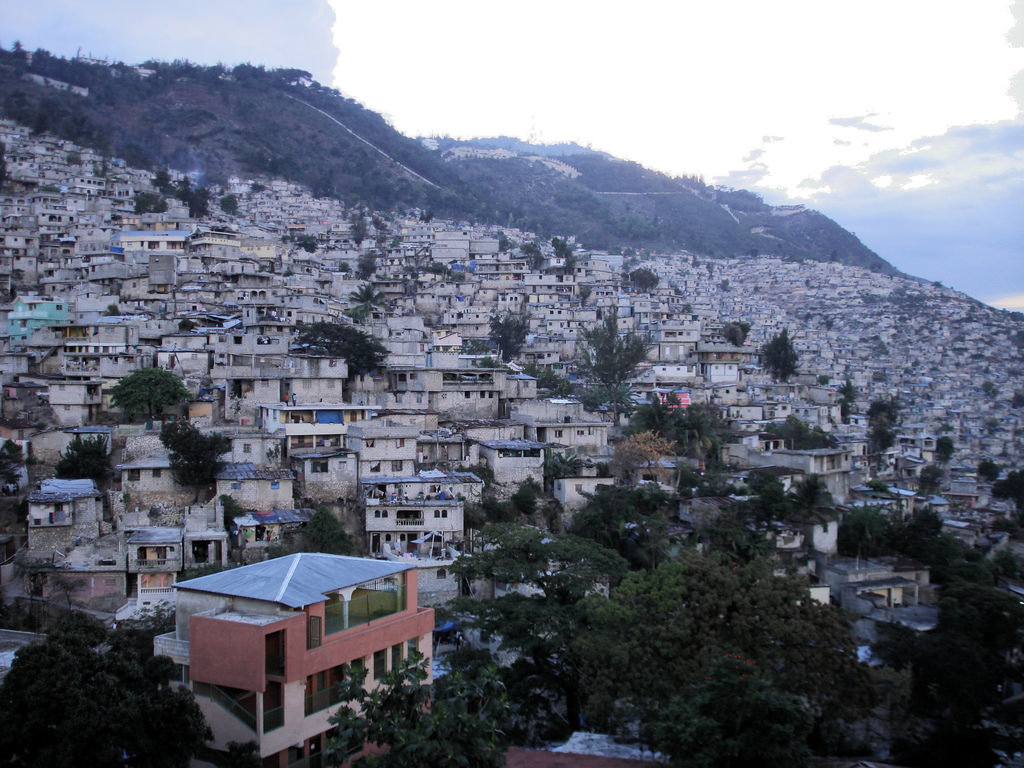
Port-Au-Prince / Southwestern Haiti
Population Prior to the Event
4.459 Million Estimated (Southwestern Haiti)
Previous Year’s Gross Domestic Product (GDP)
$6.585 Billion USD (2009)
Previous Year’s Gross Domestic Product Per Capita
$674.30 USD (2009)
Source(s)
• US Geological Survey
• World Bank Group
[ Exposures ]
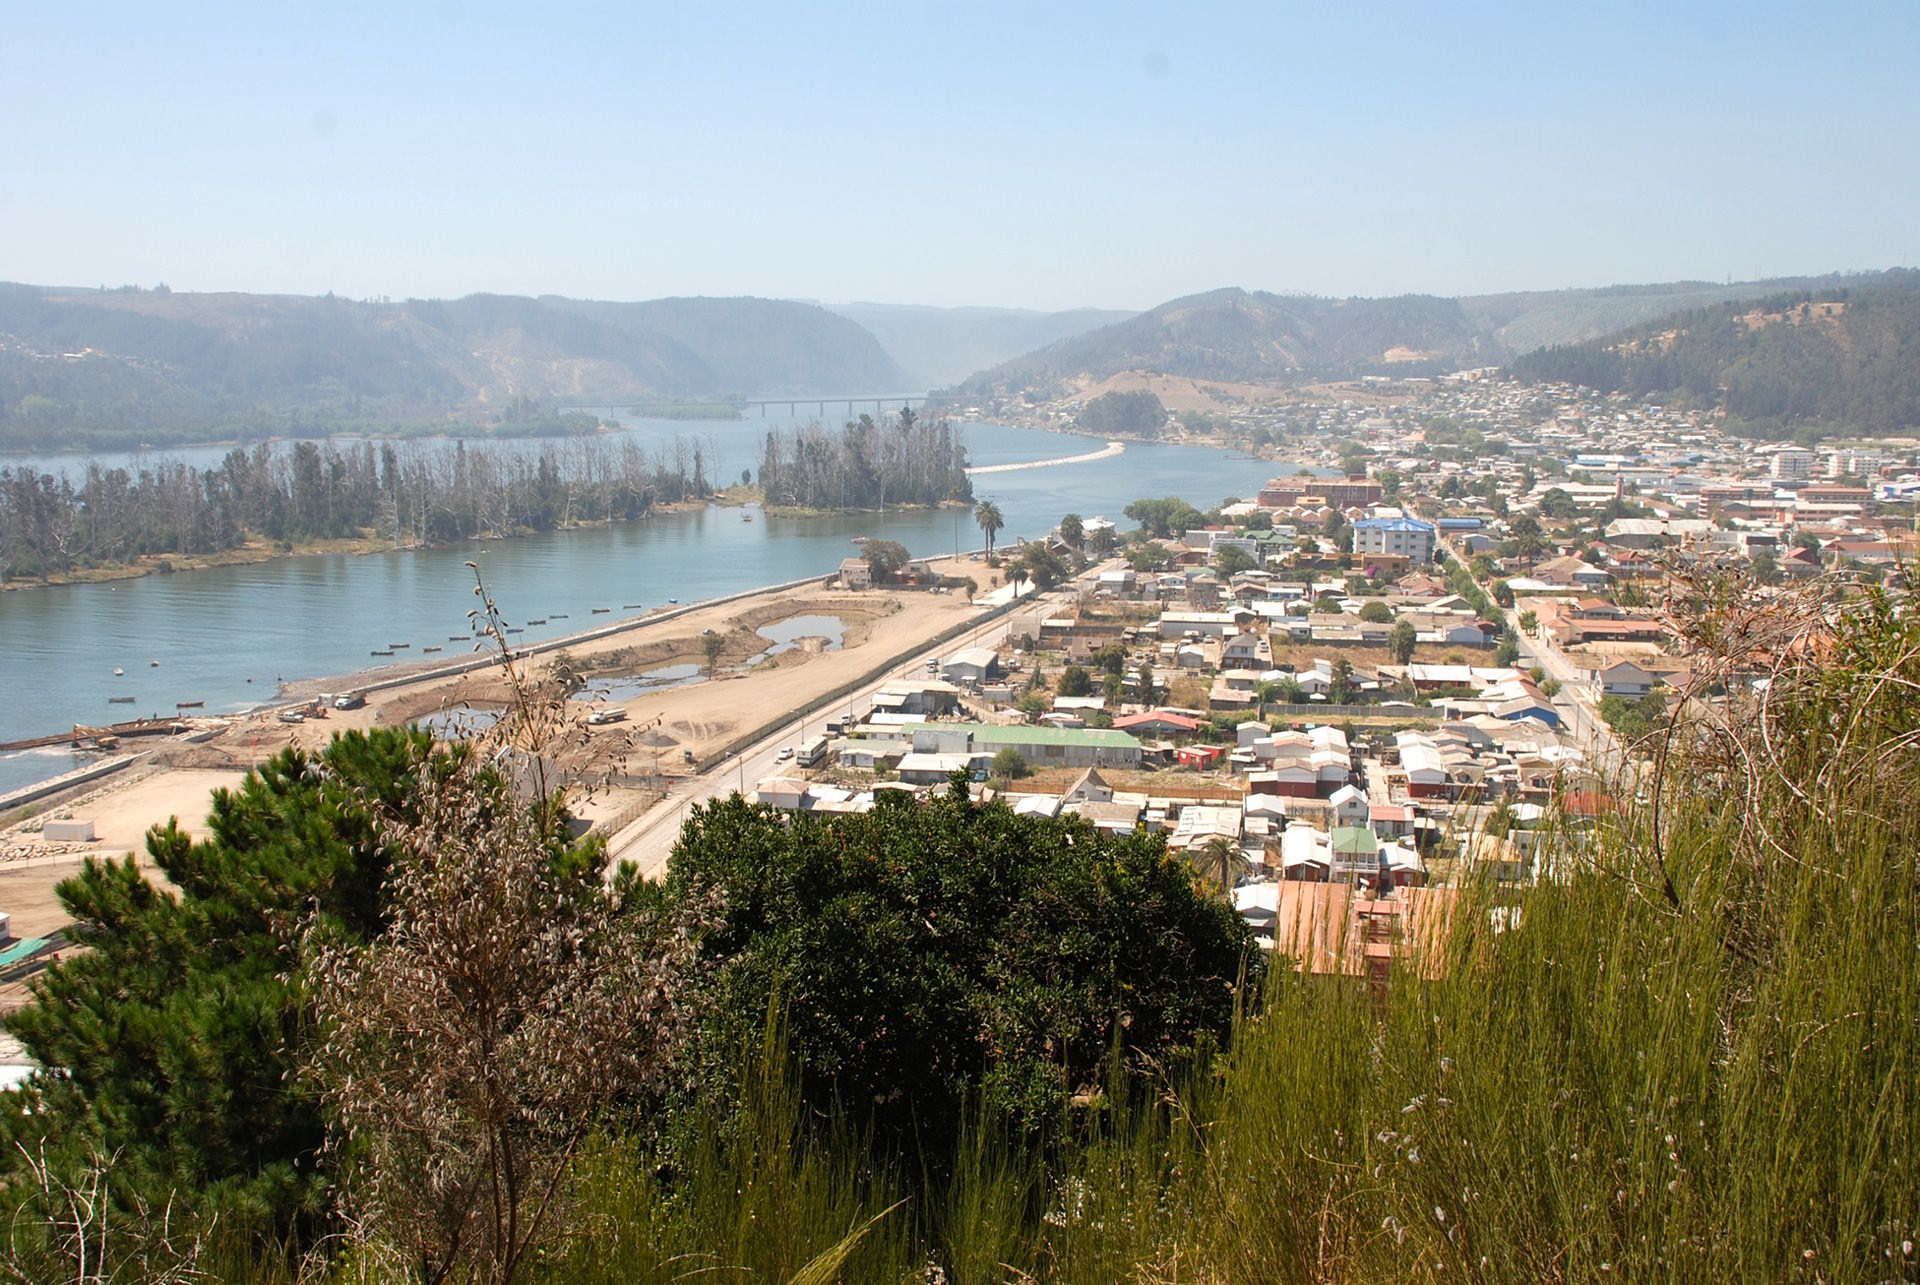
Principal Area of Impact
Concepcion and Constitucion / Central Chile
Population Prior to the Event
13.656 Million Estimated (Central Chile)
Previous Year’s Gross Domestic Product (GDP)
$172.3 Billion USD (2009)
Previous Year’s Gross Domestic Product Per Capita
$10,141.60 USD (2009)
Source(s)
• US Geological Survey
• World Bank Group
[ Vulnerabilities ]
Governance
World Bank Group Indicator –
Regulatory Quality (Percentile Rank):
20.1 (2009)
World Bank Group Indicator -Government Effectiveness (Percentile Rank):
3.3 (2009)
World Bank Group Indicator –
Rule of Law (Percentile Rank):
5.2 (2009)
World Bank Group Indicator – Voice and Accountability (Percentile Rank):
29.9 (2009)
World Bank Group Indicator – Political Stability and Absence of Violence (Percentile Rank):
16.6 (2009)
Corruption
World Bank Group Indicator – Control of Corruption (Percentile Rank):
11 (2009)
Transparency International Corruption Perception Index Score:
1.8 (2009)
Transparency International Corruption Perception Index Rank:
168 out of 180 (2009)
Development
World Bank Group - GINI Index:
Not Available
Human Development Index Score (HDI):
0.532 (2007)
Human Development Index Rank (HDI):
149 out of 182 (2007)
Source(s)
• World Bank Group
• Transparency International
• UNDP Human Development Report 2009
[ Vulnerabilities ]
Governance
World Bank Group Indicator –
Regulatory Quality (Percentile Rank):
92.8 (2009)
World Bank Group Indicator -Government Effectiveness (Percentile Rank):
85.2 (2009)
World Bank Group Indicator –
Rule of Law (Percentile Rank):
87.7 (2009)
World Bank Group Indicator – Voice and Accountability (Percentile Rank):
78.7 (2009)
World Bank Group Indicator – Political Stability and Absence of Violence (Percentile Rank):
67.3 (2009)
Corruption
World Bank Group Indicator – Control of Corruption (Percentile Rank):
89 (2009)
Transparency International Corruption Perception Index Score:
6.7 (2009)
Transparency International Corruption Perception Index Rank:
25 out of 180 (2009)
Development
World Bank Group - GINI Index:
52 (2009)
Human Development Index Score (HDI):
0.878 (2007)
Human Development Index Rank (HDI):
44 out of 182 (2007)
Source(s)
• World Bank Group
• Transparency International
• UNDP Human Development Report 2009
DR
CatR
[Risk]